Module 8.2 – Proform Speed Ratings and the Graph
This module is all about speed ratings.
We cover dynamic and static speed ratings, how they are displayed on the speed ratings graph, what they can be used for and class pars.
This module is all about speed ratings.
We cover dynamic and static speed ratings, how they are displayed on the speed ratings graph, what they can be used for and class pars.
At the bottom of this screen we have added thirteen new fields for querying LTO user rating ranks, values and clearbys and also LTO speed figure.
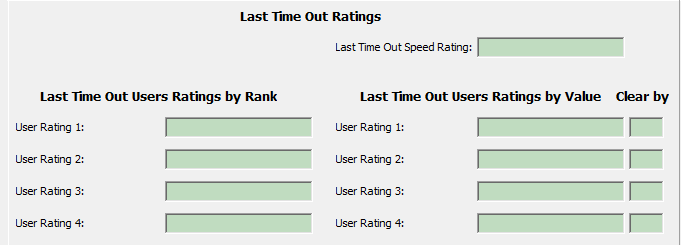
Primarily we added these for those of you using sectional times data from Timeform. This is imported into user rating 4 (the finishing speed %) and user rating 3 (upgrade figure).
Now that you can query the last time out values stored from the sectionals more analysis can be performed.
This would show you the bottom line figures for horse who last time out ran in a AW class 4 race and recorded a speed figure above par and also a upgrade better than 0 and a finishing speed better than 100%, so in essence we have found horses who ran in a truly run class 4 AW race producing a better than par figure and a upgrade above 0.
You could do this for all the different classes and race types and find some very neat profitable angles.
All the class pars can be found here
In this software release we have added presentations for LTO User Rating Ranks and Values for all 4 user ratings.
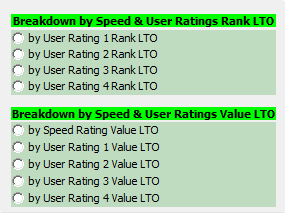
This feature should help when researching your imported ratings and specifically sectional finishing speeds and upgrades in user ratings 4 and 3 if you are using them.
We have also added a LTO speed rating value presentation. This is unrelated to the static speed figures; you can could query these in the previous version of code.
This feature allows you to query the actual speed figure produced last time out regardless of code of racing.
Not only does Proform application provide outstanding features in respect to its formbook, in-running analysis, system builder and racing statistics, the Proform software also provides its own unique ratings and in this video, we provide a list of the ratings are available in the Proform Professional software.
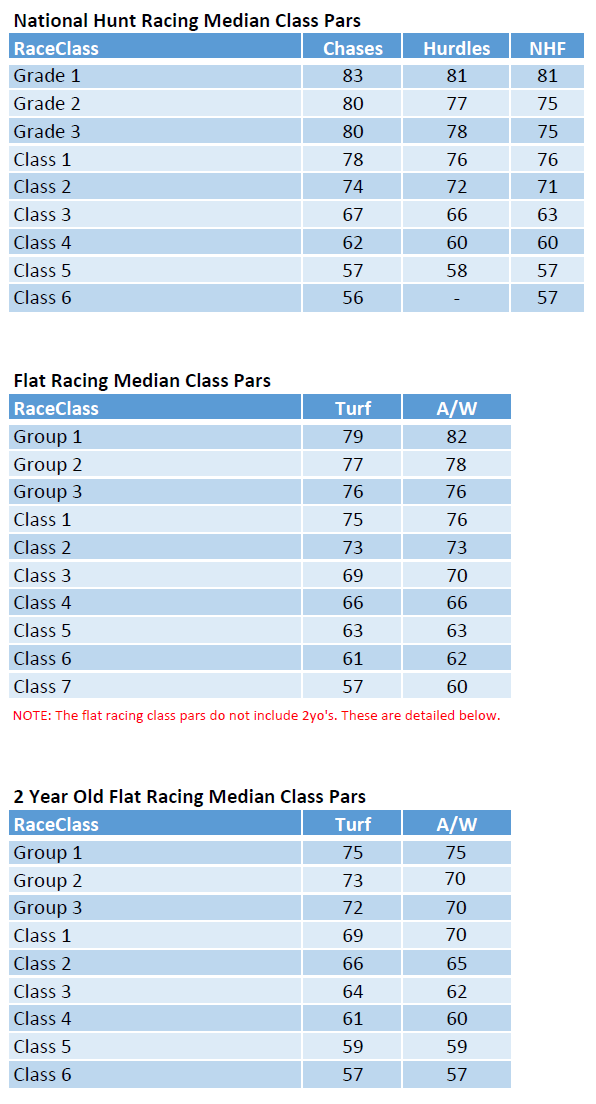
Class Pars are the median figures for winners for each class of race in each of the five race types.
The data used is for UK horse racing since 2006. Here are the tables of class pars for flat and jumps.
How to Use Class Pars
One way is to only look at horses in a race that have clocked a speed figure that is higher than the median for that race type and class.
Lets look at an example using Last Time Speed Ratings.
From above we can see that the median speed rating for Class 1 AW races is 76.
If we use the system builder to analyse Class 1 AW races from 2006 onwards and then add in a parameter of <76 against the Last Time Out Ratings field on the Speed Ratings by Value tab
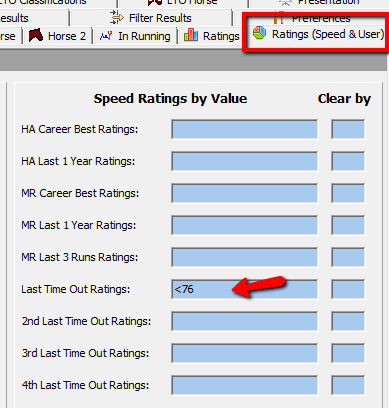
and run the system, we are returned :-

This shows how horses who last time out did not achieve a speed rating equal to or higher than the median for the class of race ran.
If we then change the speed ratings value parameter to >=76, the results are

We can see straight away that this is twice the strike rate of the query above.
This tells us that horses who achieved a speed rating of at least 76 last time out hold a much better chance of winning in class 1 AW races.
The rating of 76 we used is equal to the class par for class 1 AW races.
Of course you don’t need to look at just the Last Time Out speed ratings, you could use any of the speed ratings.
Find out more about our
Proform Ratings, what's available, how are they created and where can you find them
When viewing a race result in the form book you can see some top line sectional metrics, like this
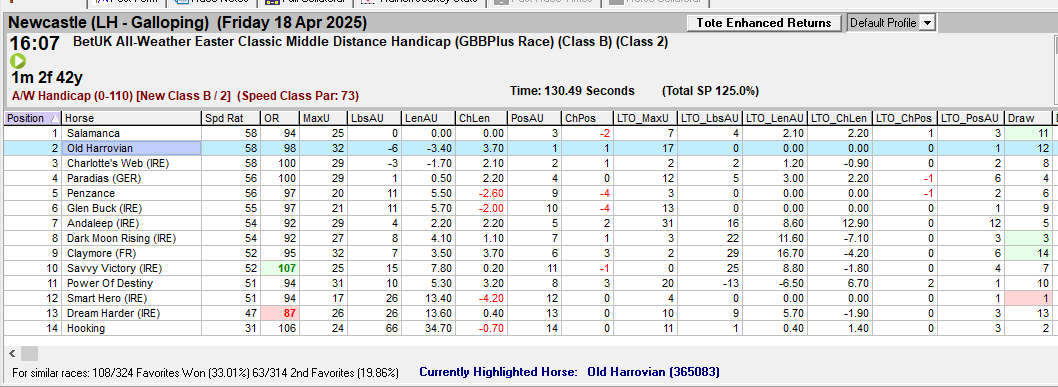
(Click image for larger version)
(NOTE: The fields will not be in the order shown. You can customise the field order by right clicking on any heading and choosing show fields from the pop-up menu which appears)
The sectional metric fields display are :-
MaxU - Max upgrade from last 4f, which is how many pounds they could have improved by running the section more efficiently (pounds)
LbsAU - Pounds (LBS) behind winner after upgrade
LenAU - Lengths behind winner after upgrade
ChLen - This is difference between the actual lengths beaten and the lengths after applying the upgrade lengths
PosAU - This is the theoretical finishing position after applying the upgrade
ChPos -This is the difference between the actual finishing position and the theoretical finishing position
LTO_MaxU - Last Time Out - Max upgrade from last 4f, which is how many pounds they could have improved by running the section more efficiently (pounds)
LTO_LbsAU - Last Time Out - Pounds (LBS) behind winner after upgrade
LTO_LenAU - Last Time Out - Lengths behind winner after upgrade
LTO_ChLen - Last Time Out - This is difference between the actual lengths beaten and the lengths after applying the upgrade lengths
LTO_PosAU - Last Time Out - This is the theoretical finishing position after applying the upgrade
LTO_ChPos -Last Time Out - This is the difference between the actual finishing position and the theoretical finishing position
We have created an excel document explaining all the data fields you can see in Proform, plus how far back the historical sectional data goes and the data tolerances we used to block obvious data errors coming into our database, you can download this on the following link:-
DOWNLOAD the SECTIONAL DATA GLOSSARY
When viewing a racecard in the form book you can see some top line LTO sectional metrics, like this

(Click image for larger version)
(NOTE: The fields will not be in the order shown. You can customise the field order by right clicking on any heading and choosing show fields from the pop-up menu which appears)
The sectional metric fields display are :-
LTO_MaxU - Last Time Out - Max upgrade from last 4f, which is how many pounds they could have improved by running the section more efficiently (pounds)
LTO_LbsAU - Last Time Out - Pounds (LBS) behind winner after upgrade
LTO_LenAU - Last Time Out - Lengths behind winner after upgrade
LTO_ChLen - Last Time Out - This is difference between the actual lengths beaten and the lengths after applying the upgrade lengths
LTO_PosAU - Last Time Out - This is the theoretical finishing position after applying the upgrade
LTO_ChPos -Last Time Out - This is the difference between the actual finishing position and the theoretical finishing position
We have created an excel document explaining all the data fields you can see in Proform, plus how far back the historical sectional data goes and the data tolerances we used to block obvious data errors coming into our database, you can download this on the following link:-
DOWNLOAD the SECTIONAL DATA GLOSSARY