Sectional Tab - MPH - Form Book
The MPH tab can be seen when you have a race open and you are viewing the sectionals tab in the Proform Form Book.
It looks like this.

(Click image for larger version)
MPH
This tab shows you speed in MPH in each section. The final furlong (finish) is on the left.
Pars
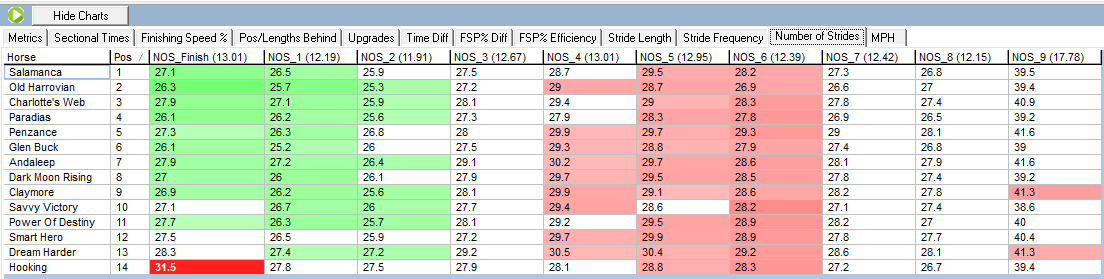
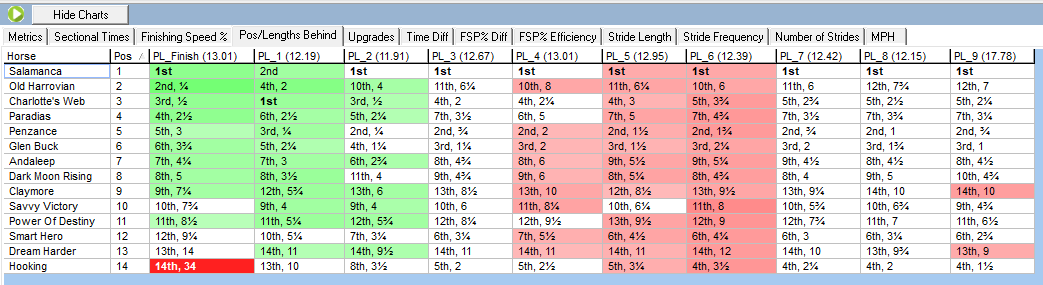
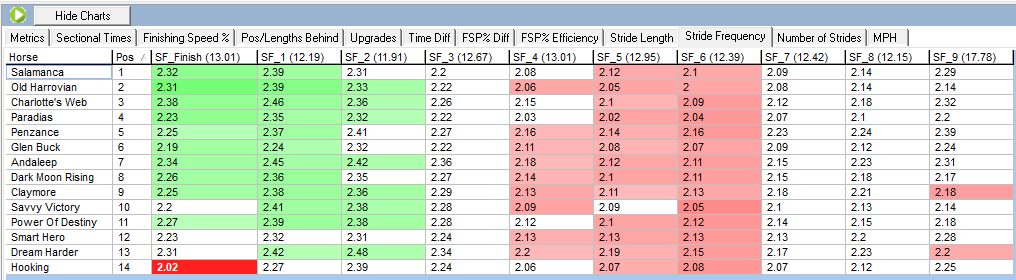
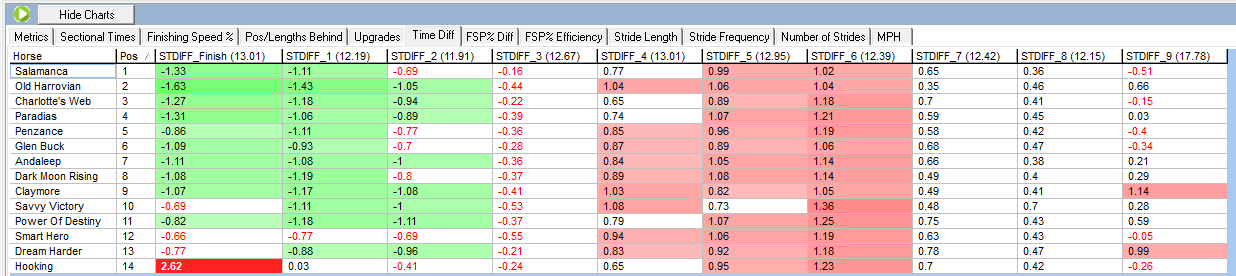
The sectional times in braces in the heading bar for each section are the ground adjusted par sectional time for this race.
Colour Coding
We have colour coded this grid using the sectional times vs par sectional time. Any sectional time that is better or worse than par (within a tolerance determined by race distance) will be shaded in degrees of green (better than par) or red (worse than par). The deeper the colour the bigger the difference either way.
Race Replay
You can also view the race replay quickly from this tab by clicking the replay icon next to the hid chart button.
We have created an excel document explaining all the data fields you can see in Proform, plus how far back the historical sectional data goes and the data tolerances we used to block obvious data errors coming into our database, you can download this on the following link:-
DOWNLOAD the SECTIONAL DATA GLOSSARY