Overview
!! NEW !! - Race Guide Version 2 Help
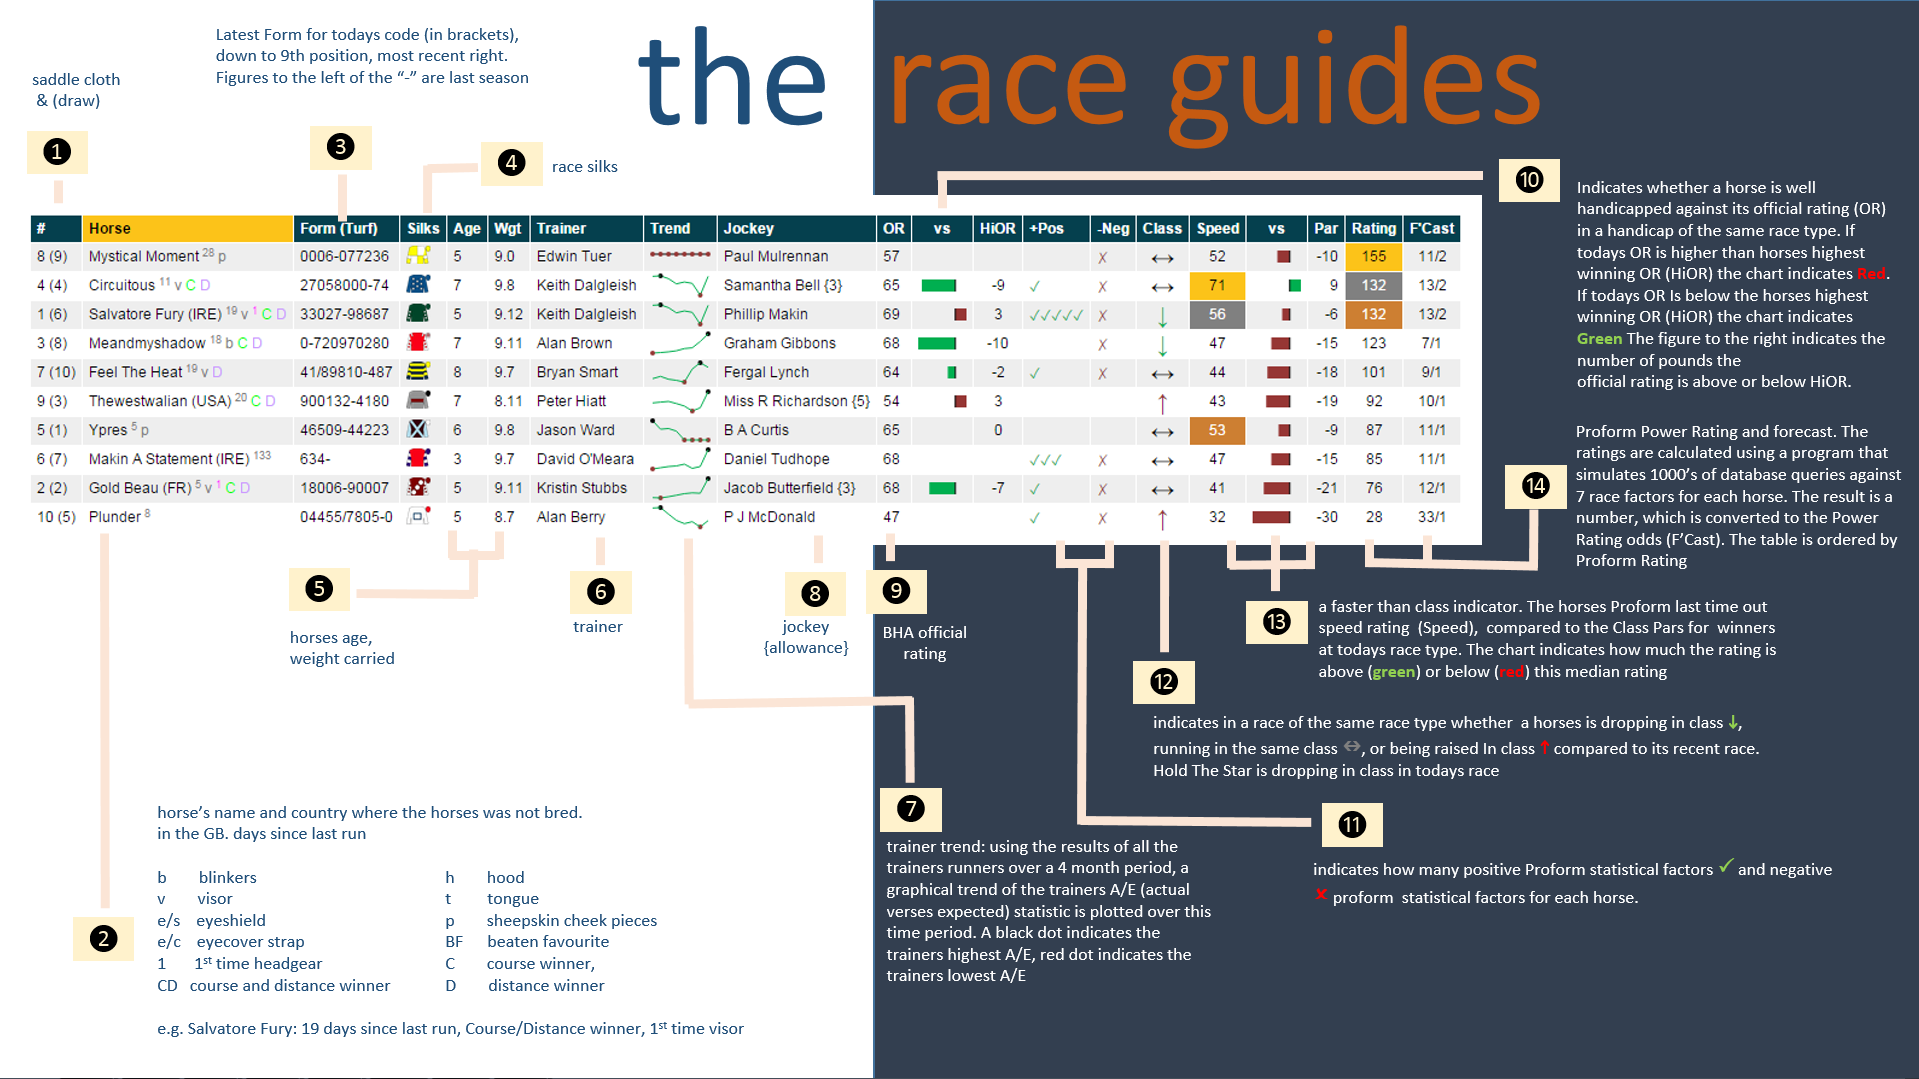
Click on image to view in another window
Using the power of Proform, we have developed the Proform Race Guide which breaks the mould to provide relevant race information for the casual and serious punter.
The Proform Race Guides feature:
- Proform Power Ratings. On average the winner is found in the top 3 power rated horse 60% of the time!
- Identification of well handicapped horses.
- Identification of horses with faster than class speed ratings.
- Utilisation of sophisticated statistical techniques presented in a graphical form for ease of interpretation.
- Summarised Trainer/Jockey course statistics and trends in easy to read tables.
- Draw Bias and Pace Map for all the runners so you can anticipate how the race could be run.
- Distance and Going preferences for horses and sires.
Plus much much more and you won’t find this type of information anywhere else!
Quick User Tips
In the section below we explain in more detail the key elements of the Race Guide, but here are some great tips on how to get started using our revolutionary Proform Race Guide information:
- Using the Proform Power Ratings, note the higher rated and closely rated horses.
- Using the horses form string determine which horses perform well given the conditions of today’s race.
- Make a note of horses that are dropping in class, who ran a speed rating faster than class in their last race and those that are well handicapped.
- Allowing for the draw bias, visualise the running of the race. Determine which horses are suited to the draw/pace conditions.
- Review horse's stable form and jockey form to determine if either are suffering from below par performances.
- Think chances! From the list of your contenders and using the Proform Race Guide betting forecast, determine which horses are underestimated in the market based on your assessment of the race.
- Use the race guide to augment your own handicapping factors, systems or process.
Power and Speed Ratings for All UK and Irish Races
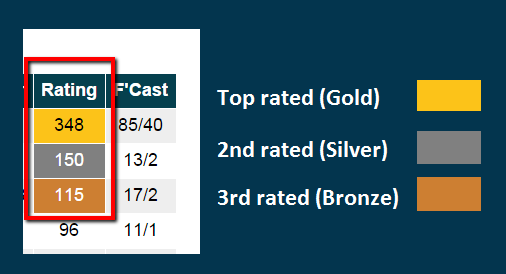
In the Race Guide, for every race we make it easy for you to identify our top three Power and Speed rated horses.
Ratings of various types appear in all sorts of publications and are typically based on the official BHA rating scale. This method is merely unravelling the handicapper's work.
Common sense dictates that you cannot outsmart the public if you are handicapping with the same information and methods as the public
Using sophisticated statistical methods, the Proform Power ratings are different in that they are calculated using software that simulates 1000’s of database queries against 7 race factors for each horse in the race.
The result is a number, which is converted to the Proform Power rating odds (F’Cast) and the race guide table is ordered by Power Rating
On average the winner is found in the top 3 Power Rated horse 60% of the time so the rating alone can go a long way to narrowing the field!
Click on this link to learn more about Proform Power Ratings
Speed Ratings
Speed ratings are a measure of a horses capabilities against the clock.
The horses last time out speed rating is scaled from 0-100 and is non weight adjusted.
The average punter ignores race times and, given the choice between a previous impressive winner and one that has won in a particularly fast time they invariably support the impressive runner.
They are probably right more often than not, but the edge is with the fast time horses that go off at big prices next time out!
That’s why we provide each horse’s last time out speed rating in our race guides.
And remember
“Horses that ran faster than class last time out have demonstrated an ability to beat winners!”
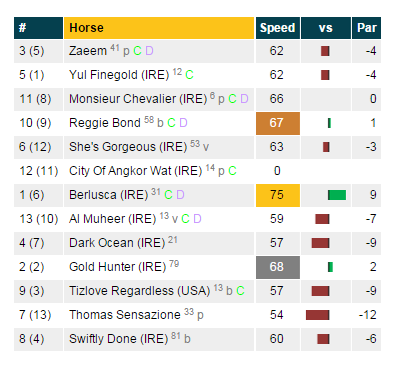
As indicated in the image above the “speed” column is the horse’s last time out Proform Speed Rating.
This number is compared to the class par for winners at today’s race type.
The chart indicates how much the rating is above (green) or below (red) this median rating. For example in the image above
- BERLUSCA speed rating last time out was 75, 9 above the median speed rating for this class.
- AL MUHEER Speed rating last time out was 59, 7 below the median speed rating for this class.
Click on this link to learn more above Proform Speed Ratings
Is the Horse Well Handicapped?
It’s a statement of fact that
“Horses running off a mark below their highest winning official rating can in theory win again off that mark”
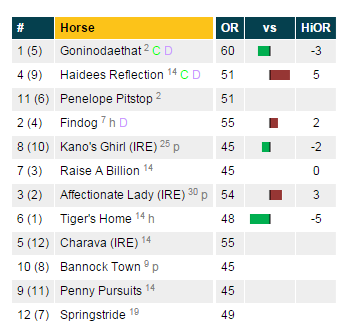
The example image above from our Race Guide above indicates whether a horse is well handicapped against its official rating (OR) in a handicap of the same race type.
- If today’s OR is higher than horses highest winning OR (HiOR) the chart indicates Red.
- If today’s OR Is below the horses highest winning OR (HiOR) the chart indicates Green.
The figure to the right indicates the number of pounds the official rating is above or below HiOR. For example in the graphic
- GONINODAETHAT is running off an OR of 60, 3 lbs below its highest winning handicap rating.
- HAIDEES REFLECTION is running off an OR of 51, 5 lbs above its highest winning handicap rating
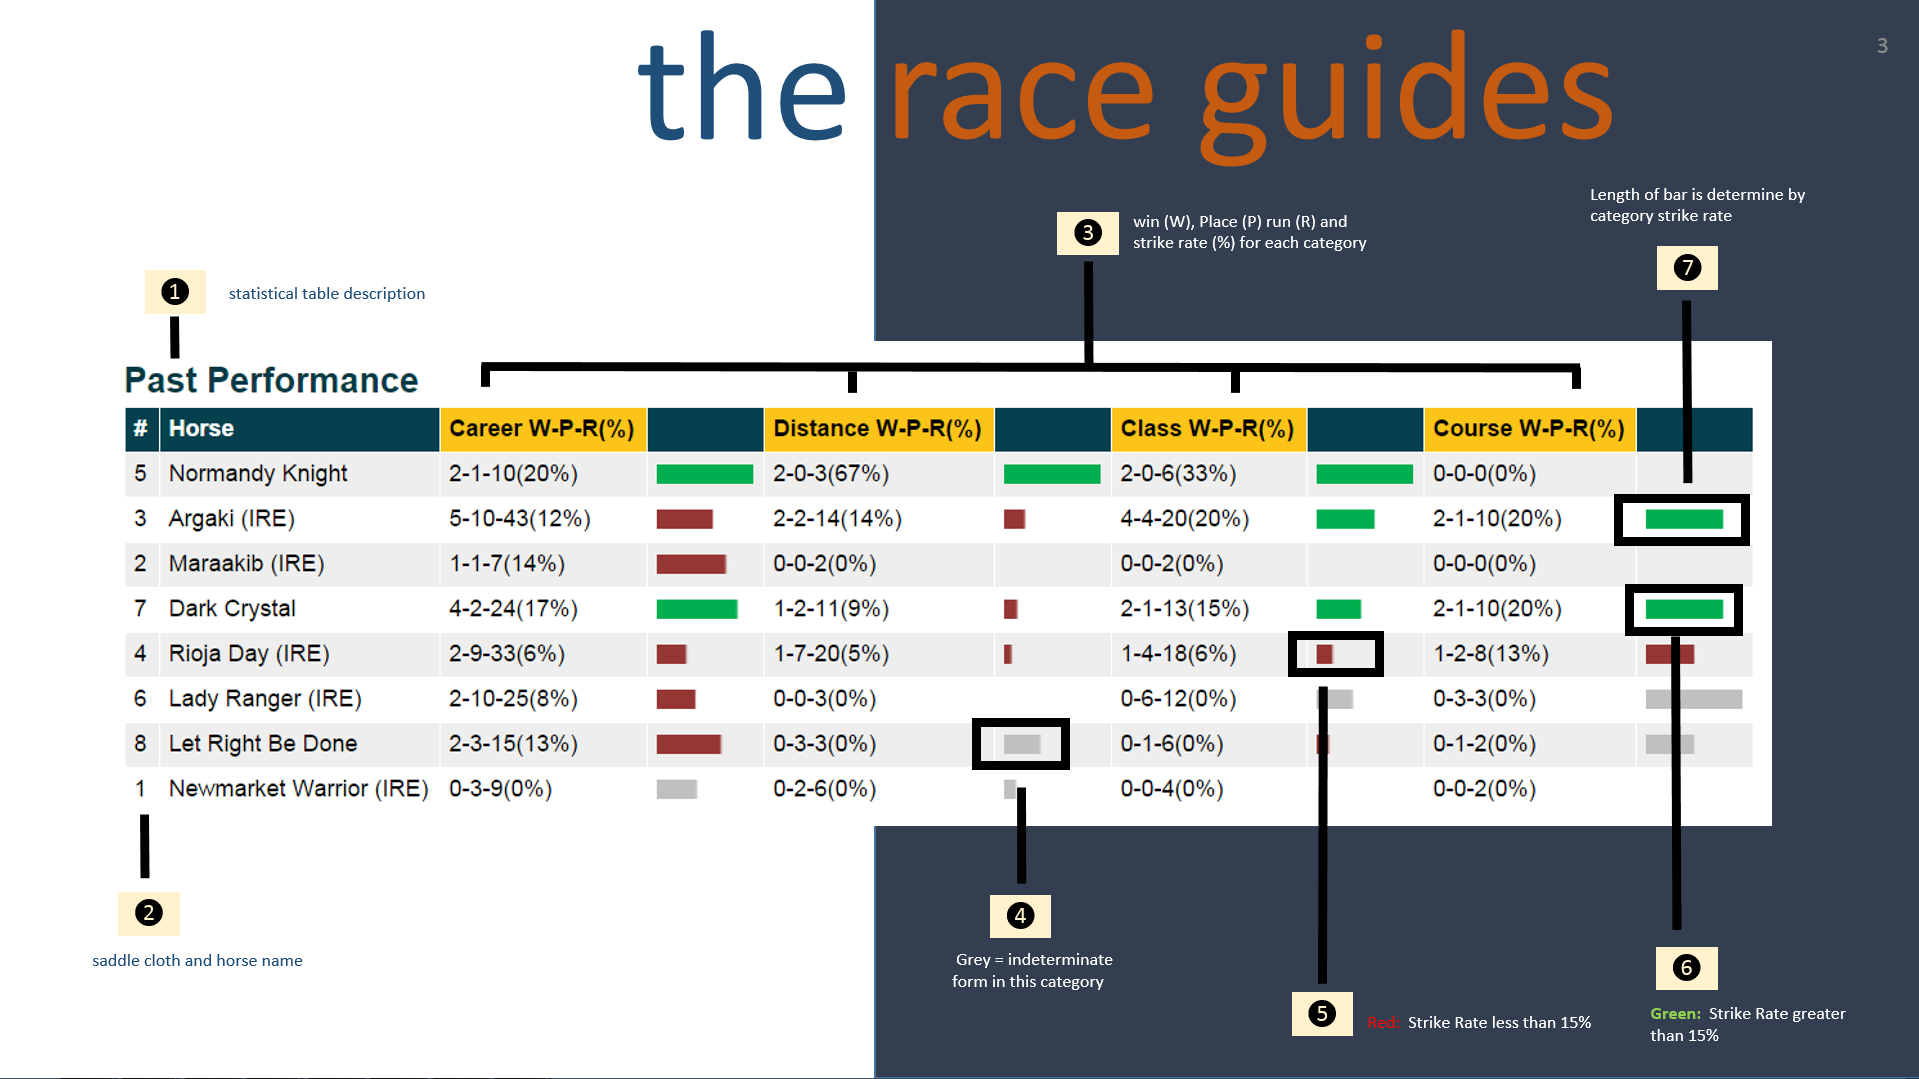
Career, Distance, Class and Course Past Performance for Every Horse
Click on image to view in another window
The past performance grid summarizes each horses record based on Win/Run percentage strike rate under each category.
Watch this video to learn more about information in this table.
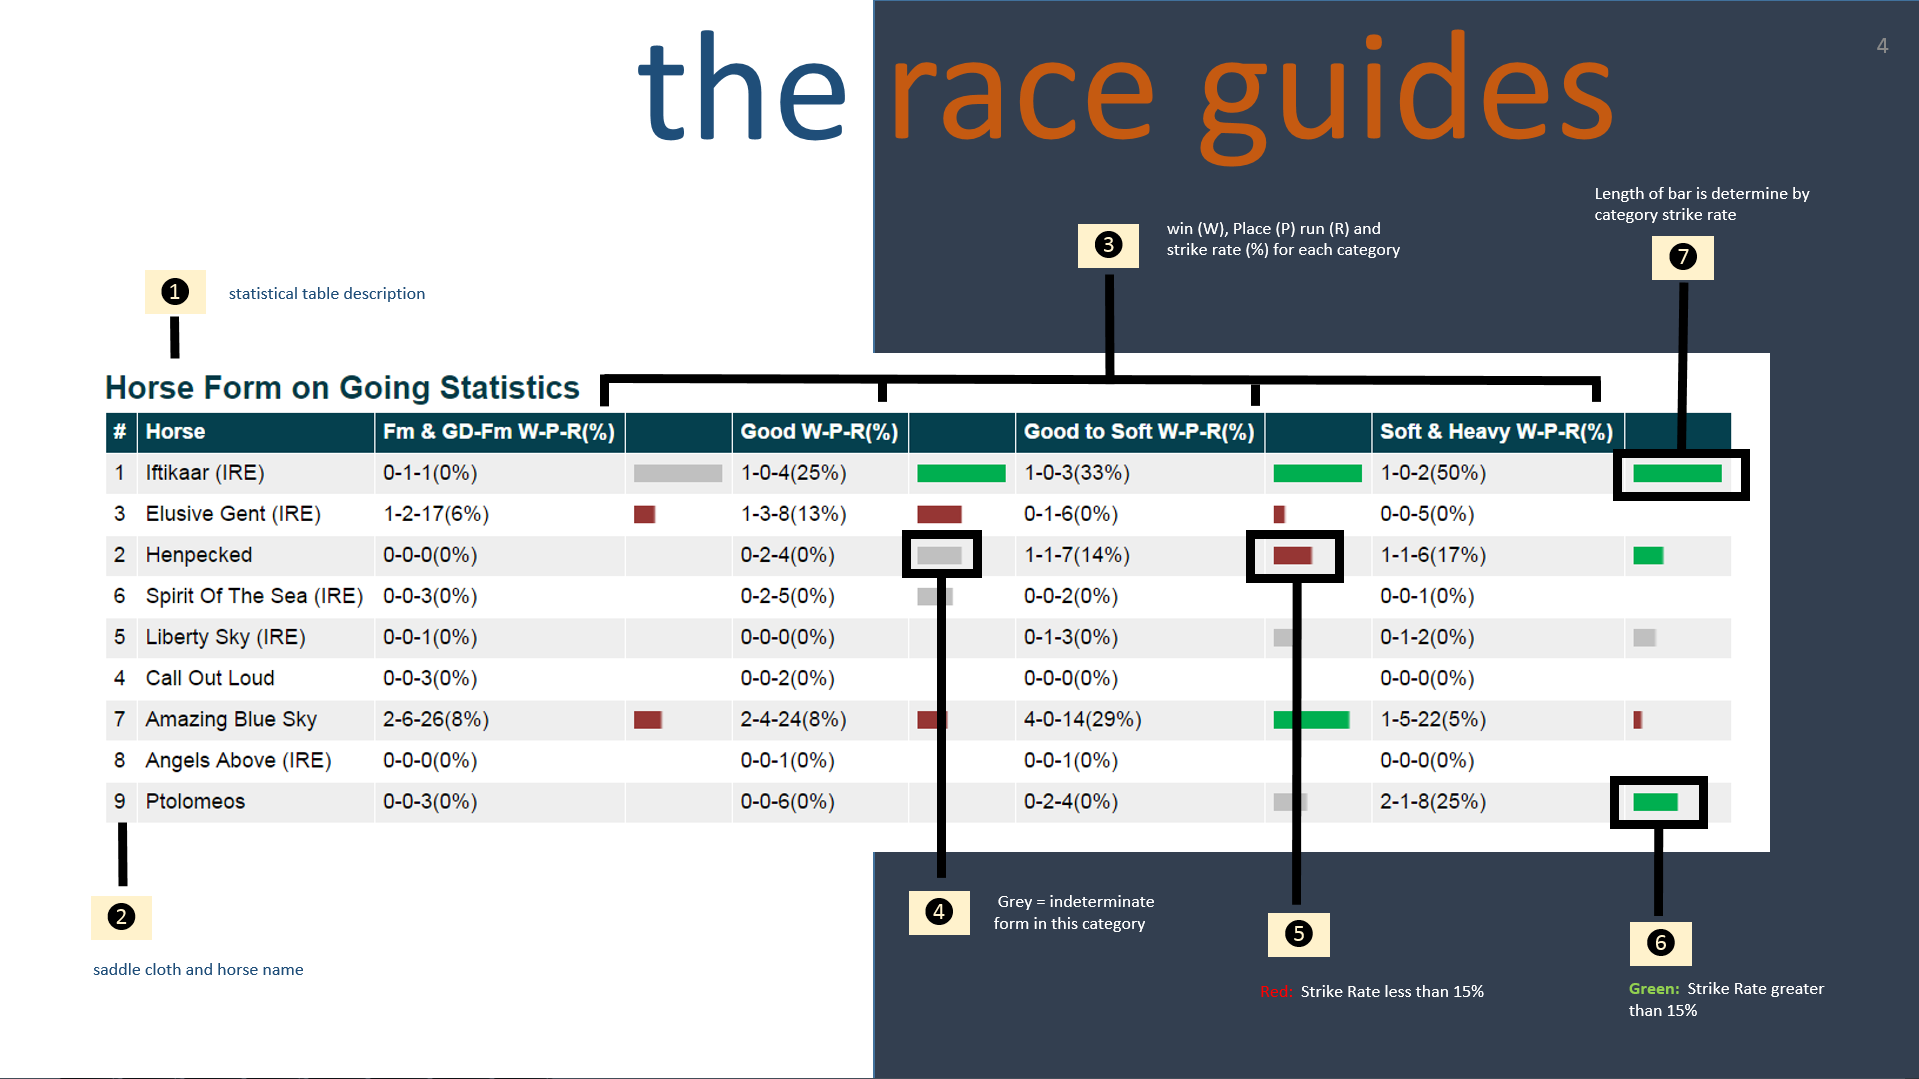
Horse Form on Going Statistics
Click on image to view in another window
Each column represents the horse’s performance on different goings logically grouped together with the official going for today’s race highlighted in yellow.
Watch this video to learn more about information in this table.
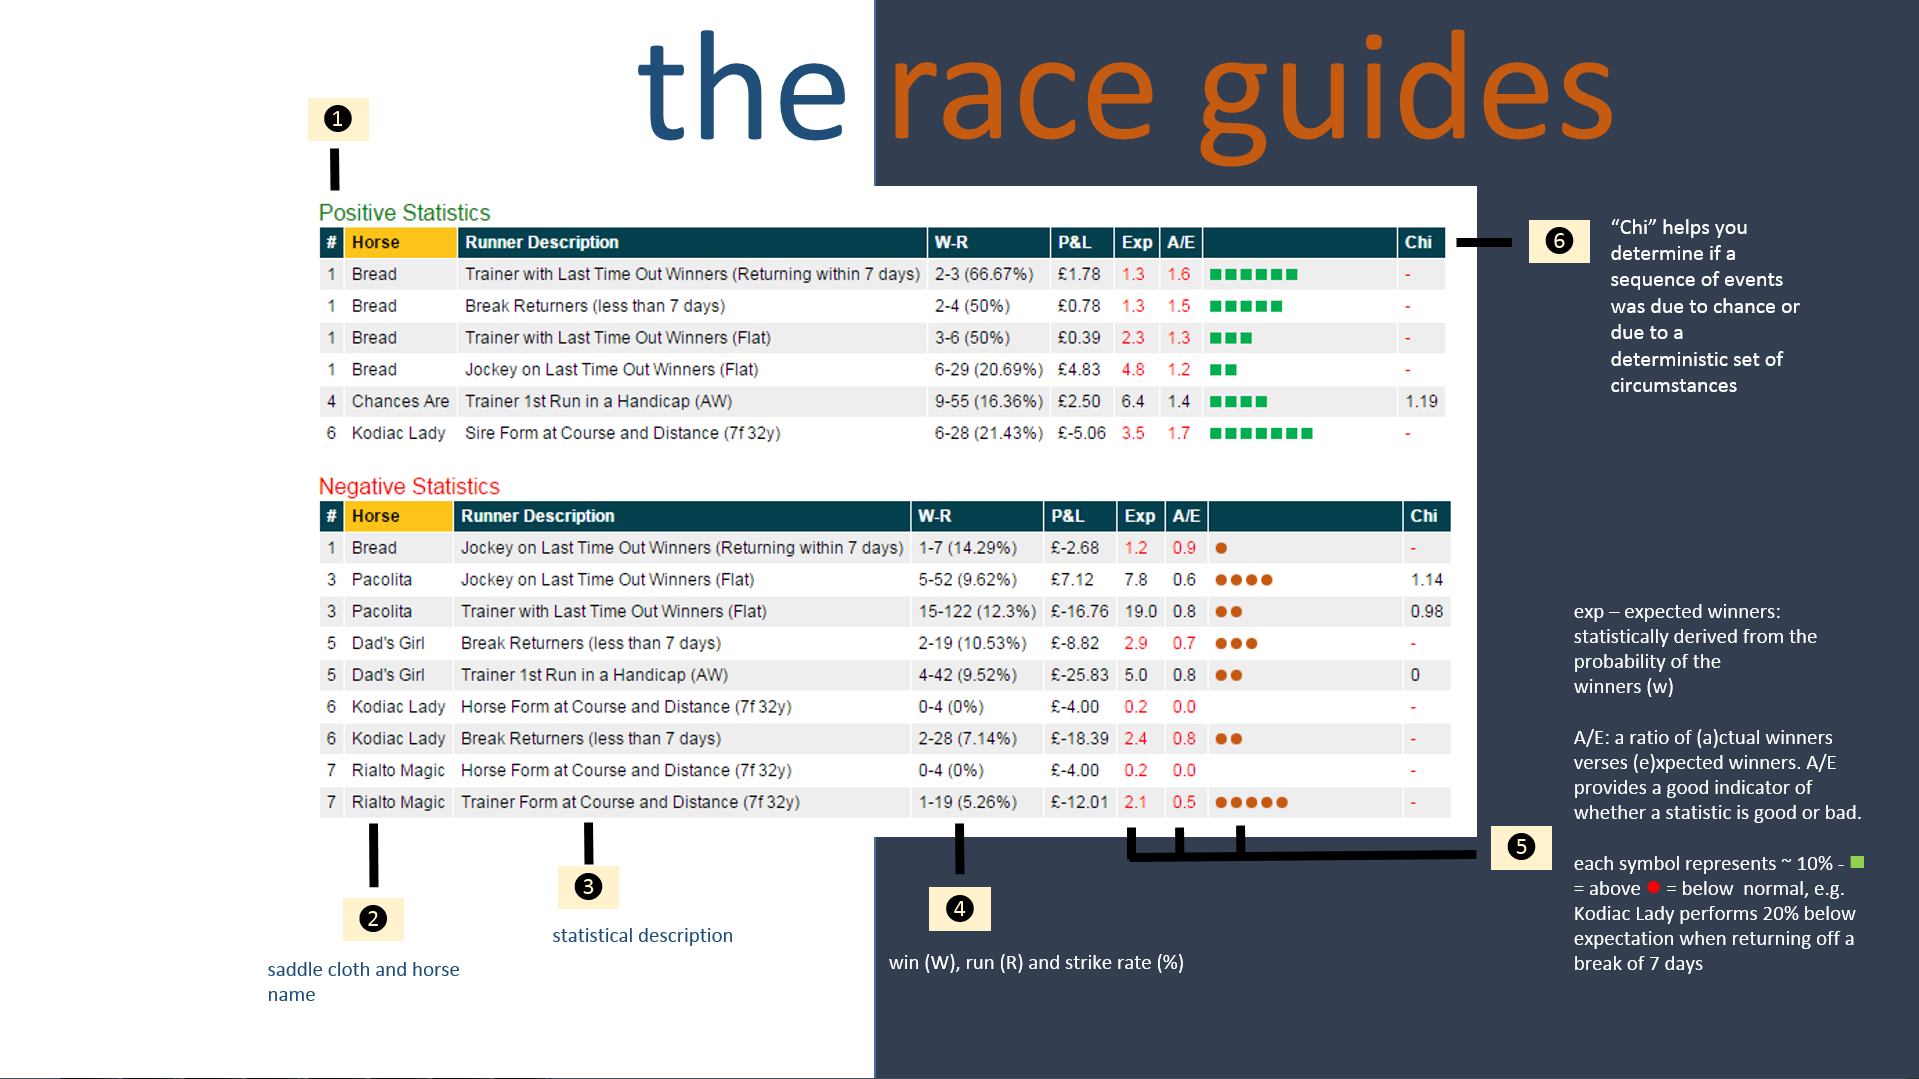
Positive and Negative Statistics
Click on image to view in another window
The positive or negative pointers refer to primary (i.e. course, distance, going) and secondary factors (i.e. sire/trainer/jockey) identified by Proform in every race.
Using our positive and negative indicators you can factor our data into your decision making process.
Watch this video to learn more about information in this table.
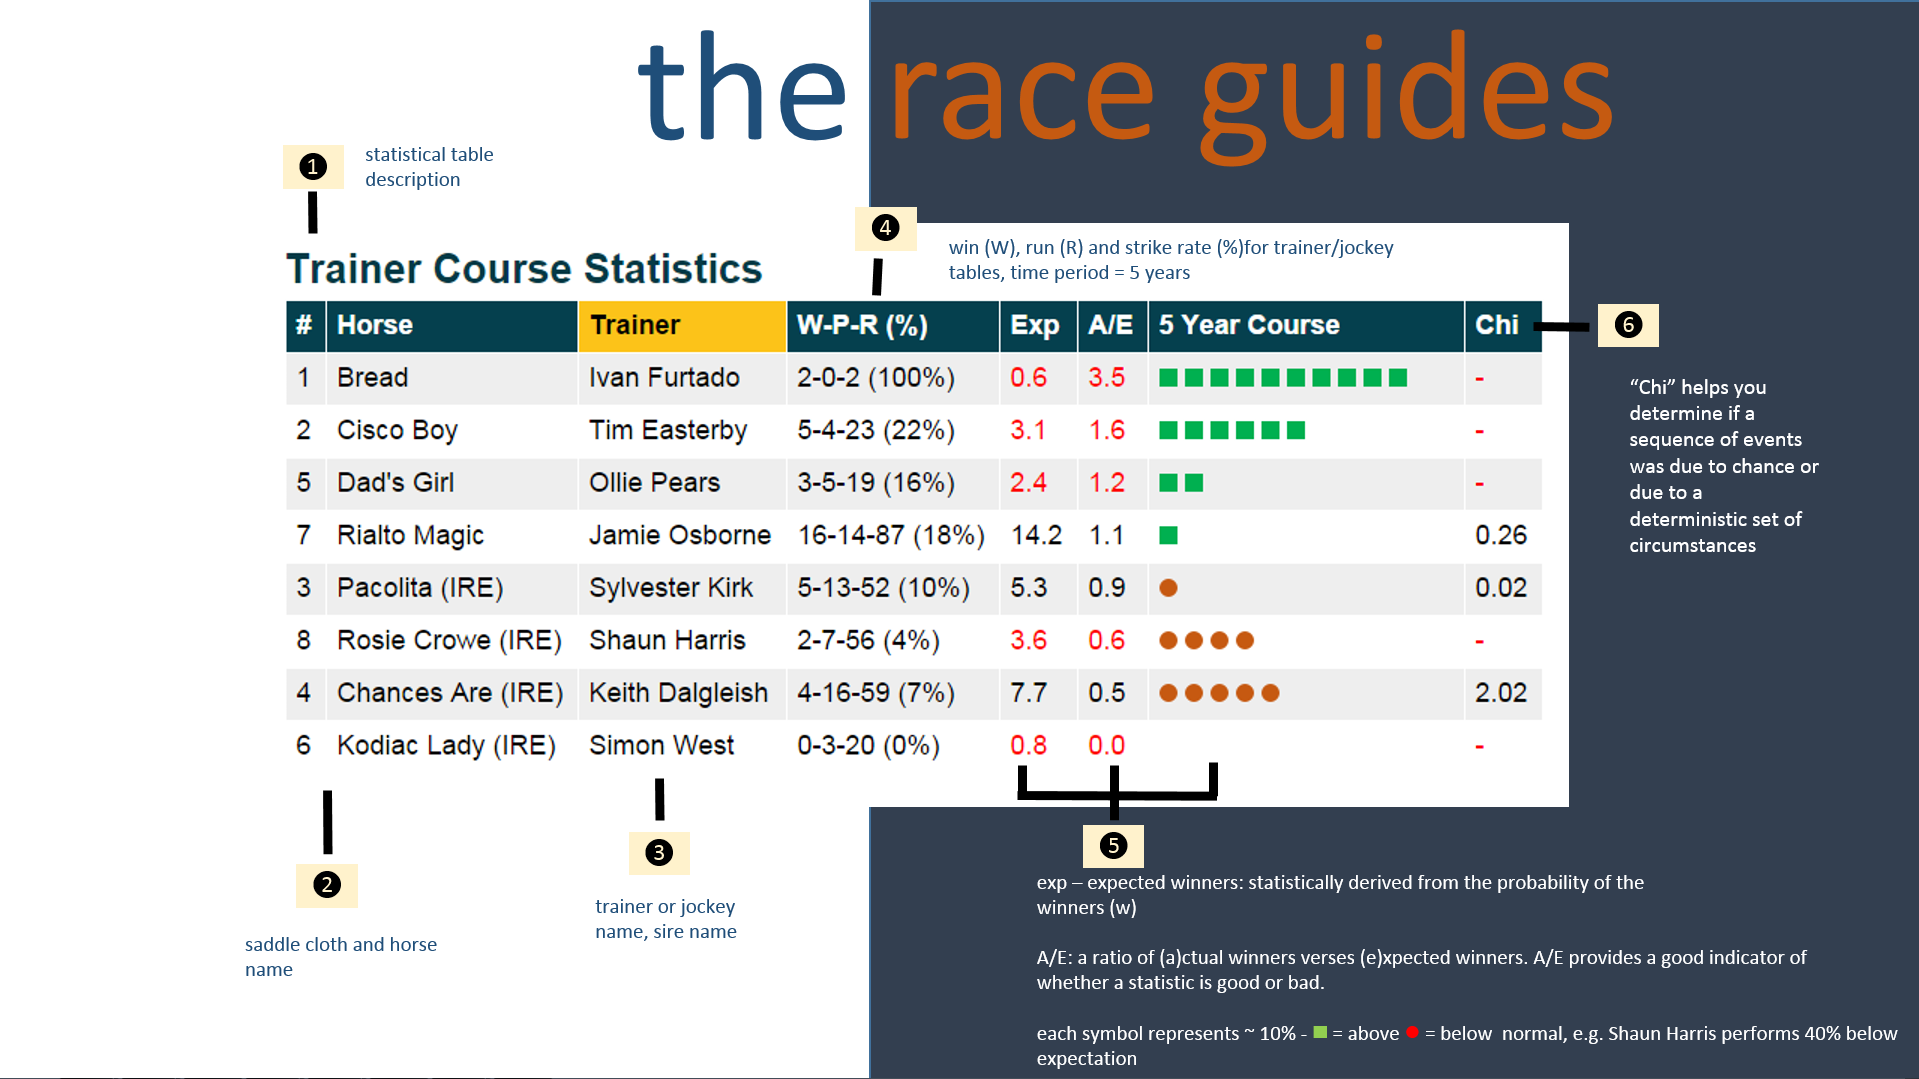
Statistical Tables – Trainer/Jockey/Sire
Click on image to view in another window
The table above the course record of the trainer in the last 5 years.
The table layout is used throughout race guide to also display stats for Jockey, Trainer and Jockey combination form and Sire related statistics.
The key statistic used in the race card is actual verses expected, commonly known as the A/E index.
The A/E index simply put, is a statistical measure of goodness for a particular group of data.
Within the race guides we use the A/E index in a number of areas to benchmark actual wins verses expected wins e.g. trainer course form.
The actual wins is derived from real results, the expected win part of the equation is calculated statistically.
An actual/expected (A/E) index is a ratio of the actual number of winners compared to the number of winners expected based on their odds.
- An A/E Index of 1.00 is considered to be as expected
- A figure below 1.00 indicates runners are winning fewer times than the odds imply (worse)
- Whereas above 1.00 is indicative of runners winning more regularly than expected. (better)
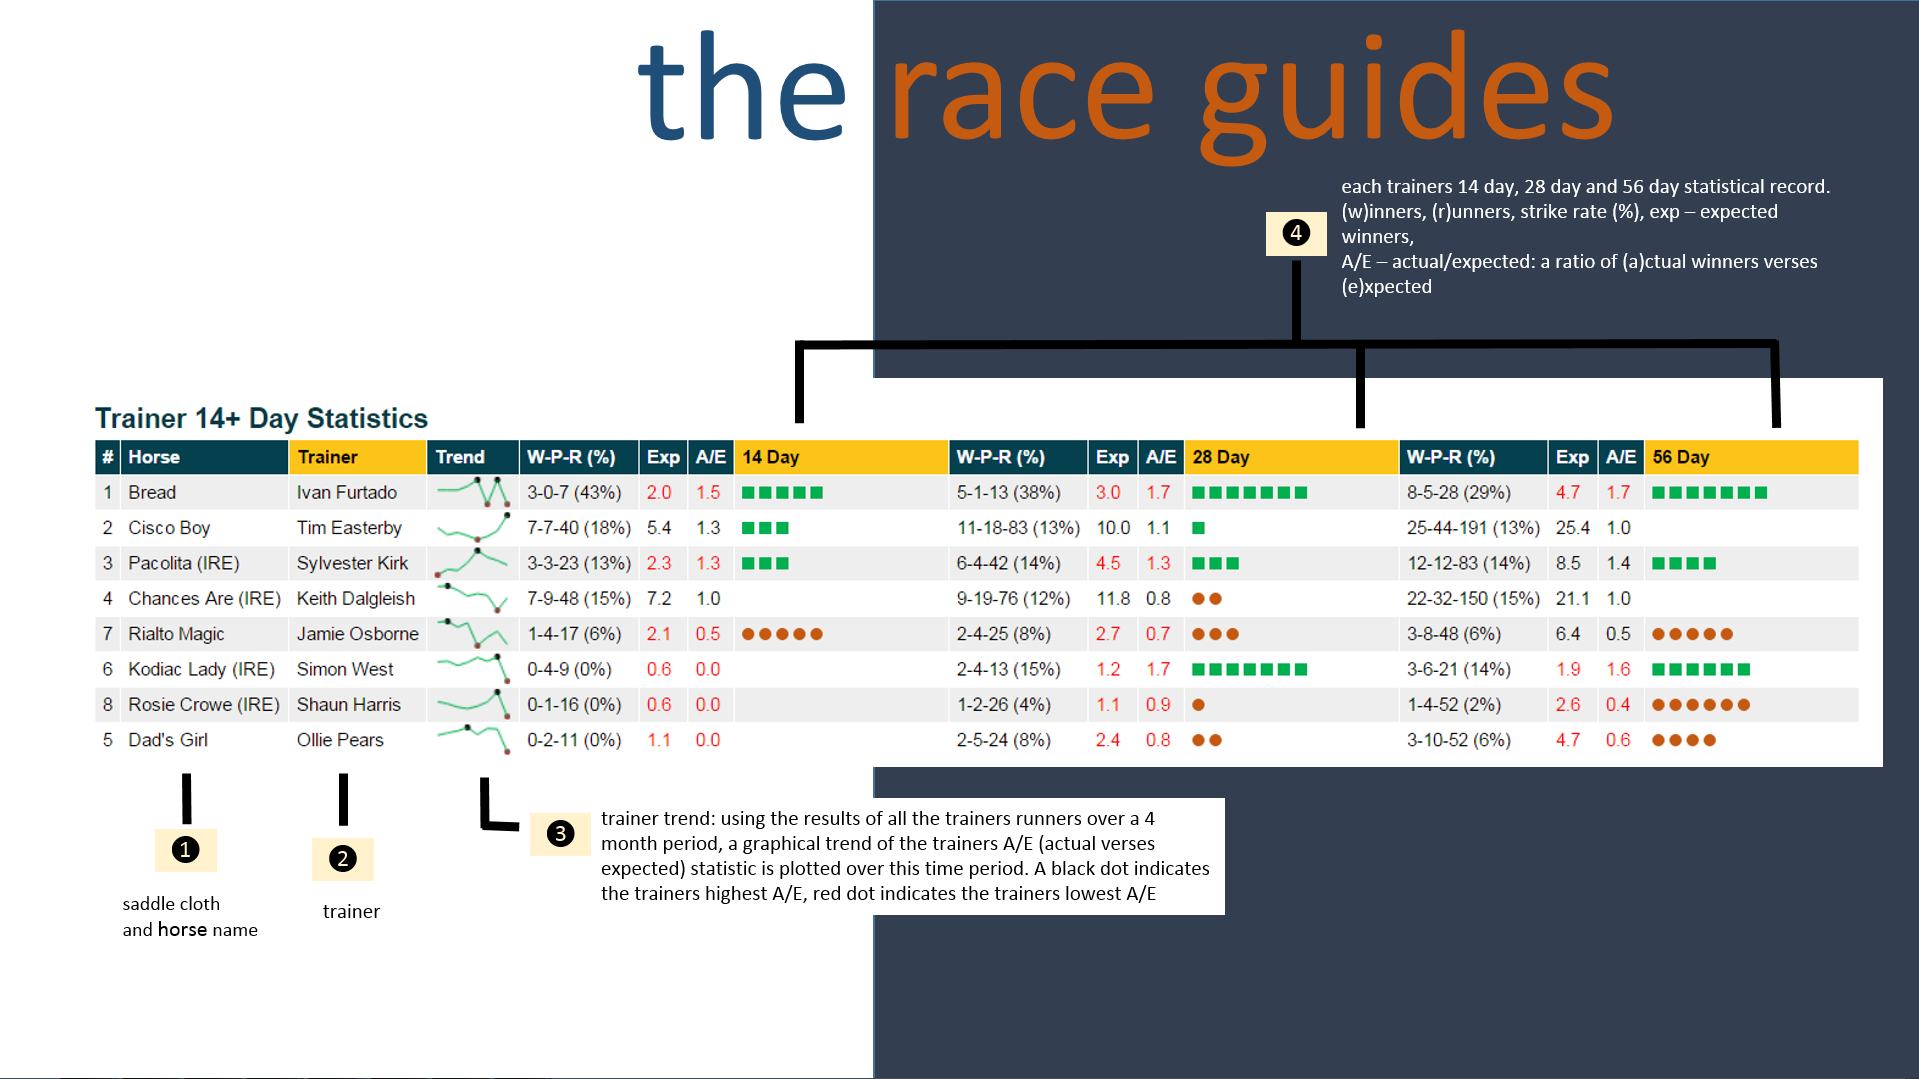
Trainer 14 Days Plus Statistics
Click on image to view in another window
This table can be used to identify the form of the trainer over a period of 14 days, 28 days and 56 days.
Draw and Pace
Click on image to view in another window
When looking at a race, the first question you should try to answer is: how is this race going to be run?
- Is it probably going to be won from starting stalls to finishing line
- Is a horse from the back of the pack likely to run down the leaders?
Pace mapping tires to visualise the pace within the race.
In conjunction with any draw bias, pace/draw analysis form a powerful weapon in the handicappers armoury!
Pace Analysis
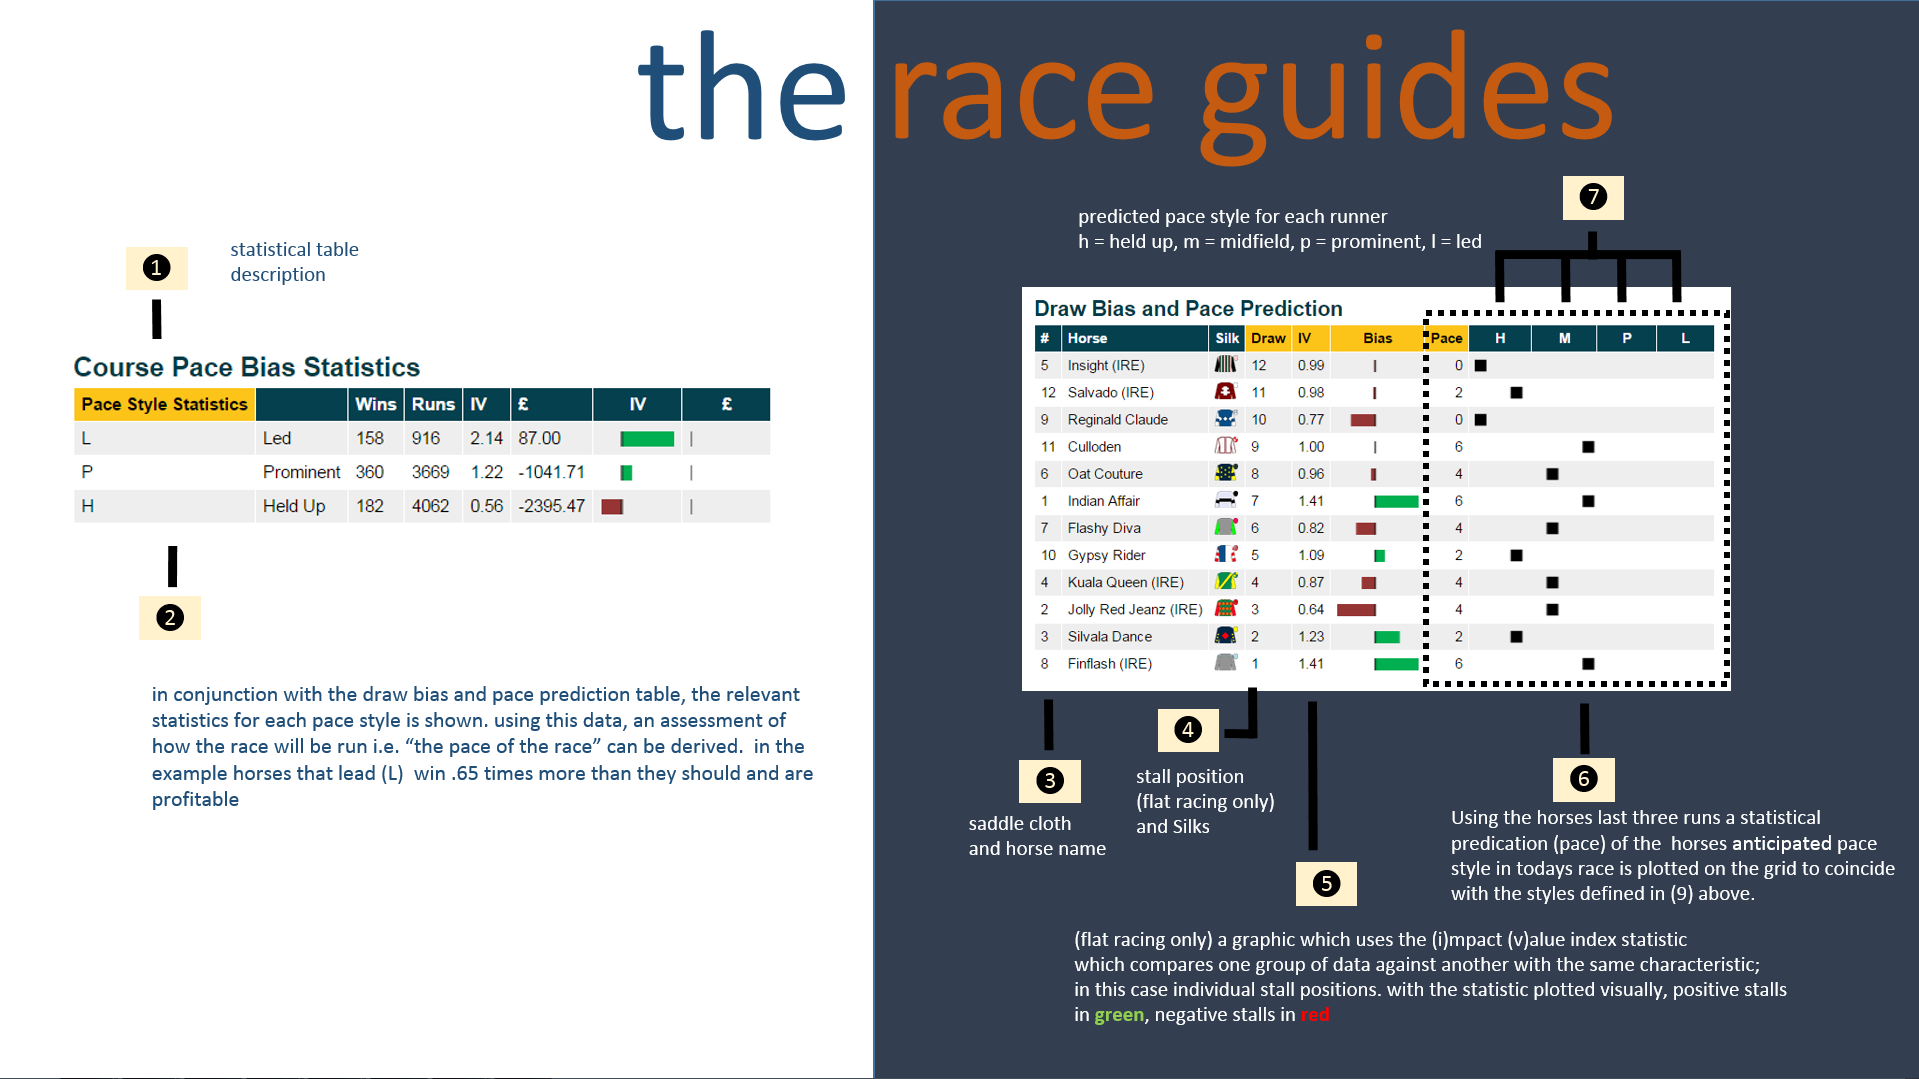
The pace column is calculated from the horses last three runs, the number is then used to map the horses pace profile on the scale below based on the following key predicted pace style for each runner h = held up, m = midfield, p = prominent, l = led
The draw bias is also shown: green for positive stall, red for negative stalls, the length of the bar indicates by magnitude of the advantage/disadvantage
The image above details the pace statistics for the course and distance in question. From the data the “course pace bias” can be determined i.e. does the course favour horses that like to lead?
The Course and Distance pace statistics detail the historical record of horses with the following running styles.
- L for Led,
- P for Prominent
- H for Held Up.
The Course Pace Bias table in the image details the historical record for each running style at the race distance. From this data you can determine which of the individual running styles is helped or hindered by any track bias
The IV column displays the Impact Value.
An impact value (IV) is an index which is a statistical measure of whether a particular running style is performing better or worse than expected.
A value of 1.00 would indicate that horses with a particular running style, win no fewer or no more than expected i.e. there is no track bias toward that running style.
Below 1.00 is indicative of underperformance, possibly due to a track bias against that style of running,
A value greater than 1.00 is above expectation suggesting a track bias which favours horses with that style of running
The “£” column lists the profit and loss for each running style at starting prices to £1 stake.
Factoring in the pace style statistics detailed by the Proform Race Guide for each horse, you can anticipate how the race will unfold under race conditions and provides a powerful tool as part of your selection methods
Fate of Favourites and is a Stat Due to Luck?
Click on image to view in another window
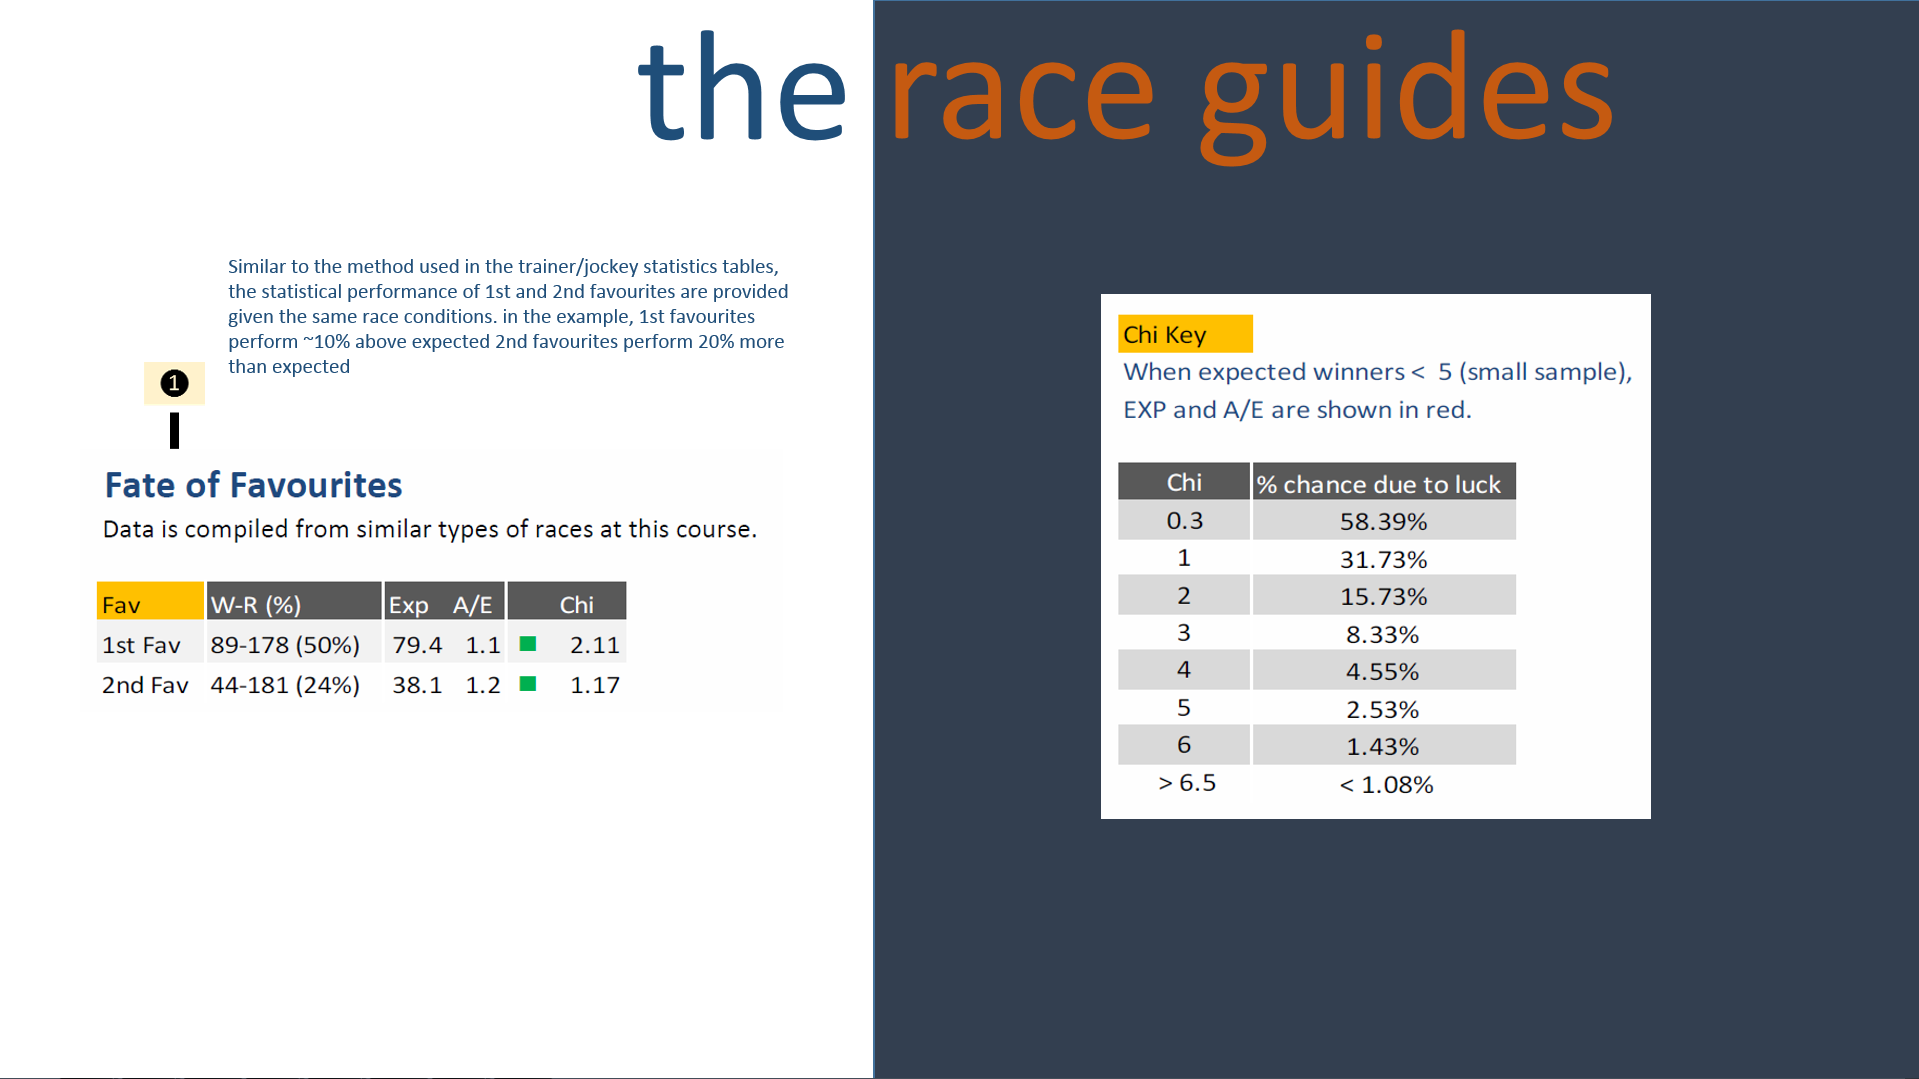
The remaining two tables in the race guide contain information on how favourites and second favourite perform in the race of the same type and the “Chi” table is that it helps you determine if a sequence of events was due to chance or due to a deterministic set of circumstances.
Click on this link to learn more about Chi and how to use it in your selection process.


