Ratings Value

Info:

Restrict your system to look for horses with specific ratings values in the respective fields

Examples of valid Ratings Values filters are:-

>= 500 (This would restrict the system to look for only horses with a ratings value of 500 or higher in the ratings field you entered the value)
>=0 and <=200 (This would restrict the system to look for horses with a ratings value of 0 to 200)

The maximum and minimum values for each rating are as follows:-
All Speed Ratings = 0 to 100

The dates when each rating started are:-
All Speed Ratings = 01/01/1997 

Sectional Data Tab in the Form Book

Info:

When you open a race in Proform there is a Sectionals tab which contains various other tabs of data, like this:-


(Click image for larger version)

The tab maybe at the top rather than bottom like we have it but you can easily move this and any other tab for that matter.

On how to move tabs, take a quick look at this video link on our youtube channel 

Sectional Log File

Info:

Log File

Every time you press the download button in Proform or it auto runs a login file is created in the folder C:\ProformP\Log

The log files have a date against them so you can see what is downloaded each date.


IMPORTANT

If you are exporting data, then it is important that you check these log files because we may have automatically updated sectional data for anytime in the past!

Sectional Tab - Finishing Speed % Difference- Form Book

Info:

The finishing speed % difference tab can be seen when you have a race open and you are viewing the sectionals tab in the Proform Form Book.

It looks like this.


(Click image for larger version)

FSP% Diff
This tab shows the difference in % of Finishing Speed % minus going adjusted Par Finishing Speed %. A positive value is better than par.  The final furlong (finish) is on the left.

Pars
The FS%'s in braces in the heading bar for each section are the ground adjusted par FS% for this race.

Colour Coding
We have colour coded this grid using the FS% vs Par FS%.  Any FS% that is better or worse than par (within a tolerance determined by race distance) will be shaded in degrees of green (better than par) or red (worse than par).  The deeper the colour the bigger the difference either way.

Race Replay
You can also view the race replay quickly from this tab by clicking the replay icon next to the hid chart button.


We have created an excel document explaining all the data fields you can see in Proform, plus how far back the historical sectional data goes and the data tolerances we used to block obvious data errors coming into our database, you can download this on the following link:-

DOWNLOAD the SECTIONAL DATA GLOSSARY

Sectional Tab - Finishing Speed % Efficiency- Form Book

Info:

The finishing speed % efficiency tab can be seen when you have a race open and you are viewing the sectionals tab in the Proform Form Book.

It looks like this.


(Click image for larger version)

FSP% Efficiency Rank
This tab shows the Efficiency rank of each section, i.e. how close to efficient each section was, lowest rank is closer to efficient.  The final furlong (finish) is on the left.

Pars
The FS%'s in braces in the heading bar for each section are the ground adjusted par FS% for this race.

Colour Coding
We have colour coded this grid using the FS% vs Par FS%.  Any FS% that is better or worse than par (within a tolerance determined by race distance) will be shaded in degrees of green (better than par) or red (worse than par).  The deeper the colour the bigger the difference either way.

Race Replay
You can also view the race replay quickly from this tab by clicking the replay icon next to the hid chart button.


We have created an excel document explaining all the data fields you can see in Proform, plus how far back the historical sectional data goes and the data tolerances we used to block obvious data errors coming into our database, you can download this on the following link:-

DOWNLOAD the SECTIONAL DATA GLOSSARY

Sectional Tab - Finishing Speed %'s - Form Book

Info:

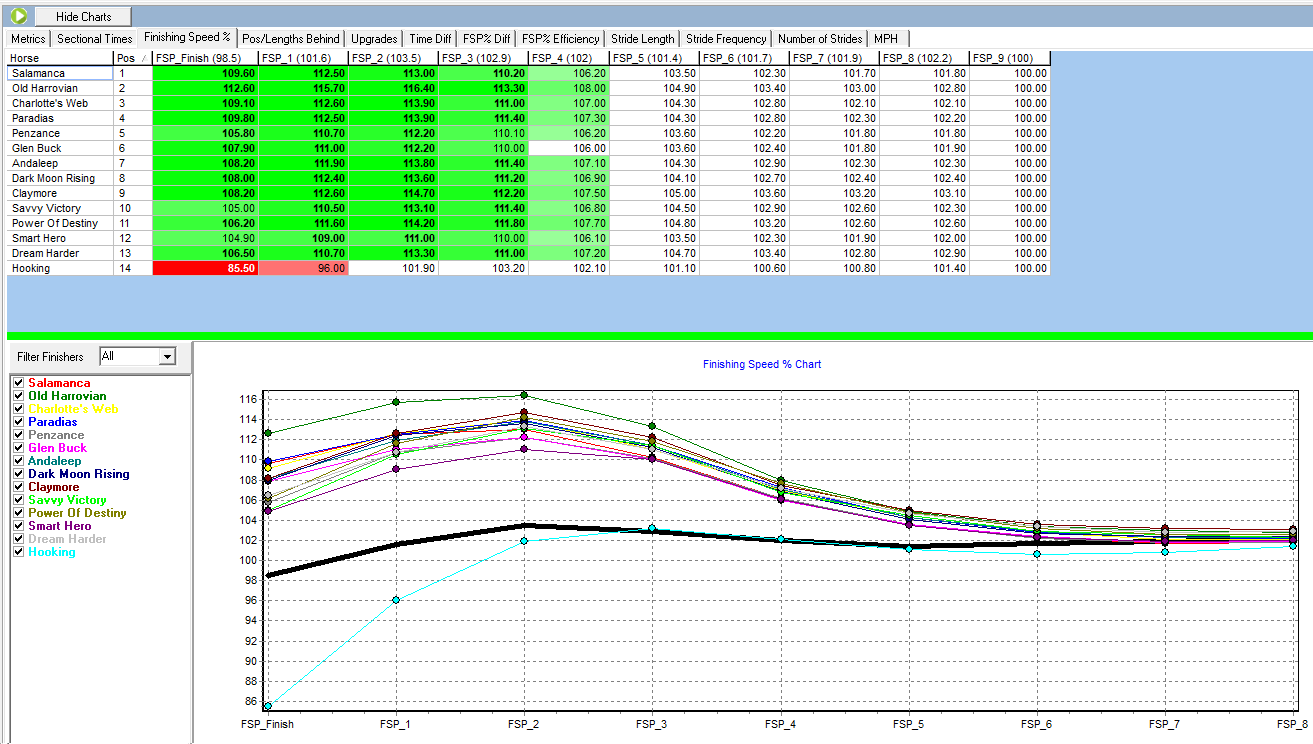
The finishing speed % tab can be seen when you have a race open and you are viewing the sectionals tab in the Proform Form Book.

It looks like this.

Finishing Speed %'s
The finishing speed %'s grid shows the FS% for each section with the final furlong (finish) on the left.

Pars
The FS%'s in braces in the heading bar for each section are the ground adjusted par FS% for this race.

Colour Coding
Any FS% that is better or worse than par (within a tolerance determined by race distance) will be shaded in degrees of green (better than par) or red (worse than par).  The deeper the colour the bigger the difference either way.

Chart
The graph under the FS% grid shows you the par FS%'s with a thick black line and then each horse is a different color on the chart, which you can see in the legend on the right.

Splitter Bar
The green splitter line between the grid and the chart can be used to size the graph.

Toggle Horses on Chart
You can tick horses on and off the graph using the tickboxes next the horse names in the graph legend.

Filter Horses on Chart
You can filter the number of horses in the graph with the filter finishers drop down list.

Hide/Show Chart
You can hide the chart using the hide chart button above the grid tab headings

Race Replay
You can also view the race replay quickly from this tab by clicking the replay icon next to the hid chart button.


We have created an excel document explaining all the data fields you can see in Proform, plus how far back the historical sectional data goes and the data tolerances we used to block obvious data errors coming into our database, you can download this on the following link:-

DOWNLOAD the SECTIONAL DATA GLOSSARY

Sectional Tab - Metrics - Form Book

Info:

The sectional metrics tab can be seen when you have a race open and you are viewing the sectionals tab in the Proform Form Book.

It looks like this.


(Click image for larger version)

The green and red shaded cells show you the highest (green) and lowest (red) value in each column.

The data fields on this screen are:-

Horse Name

Pos = Finishing Position

Dtw = Distance to winner (lengths)

MaxU - Max upgrade from last 4f, which is how many pounds they could have improved by running the section more efficiently (pounds)

LbsAU - Pounds (LBS) behind winner after upgrade

LenAU - Lengths behind winner after upgrade

ChLen - This is difference between the actual lengths beaten and the lengths after applying the upgrade lengths

PosAU - This is the theoretical finishing position after applying the upgrade

ChPos -This is the difference between the actual finishing position and the theoretical finishing position

TTR5 - Time from out of the gate to reach 5mph (seconds)

TTR10 - Time from out of the gate to reach 10mph (seconds)

TTR20 - Time from out of the gate to reach 20mph (seconds)

TTR25 - Time from out of the gate to reach 25mph (seconds)

TTR30 - Time from out of the gate to reach 30mph (seconds)

ROS - Late speed recorded 2 seconds after crossing the finishing line (mph)

TS - Average top speed reach at any point in the race (mph)

MINSL - Minimum Stride Length (feet)

ASL - Average Stride Length (feet)

MAXSL - Maximum Stride Length (feet)

MINSF - Minimum Stride Frequency (strides per second)

ASF - Average  Stride Frequency (strides per second)

MAXSF - Maximum Stride Frequency (strides per second)


We have created an excel document explaining all the data fields you can see in Proform, plus how far back the historical sectional data goes and the data tolerances we used to block obvious data errors coming into our database, you can download this on the following link:-

DOWNLOAD the SECTIONAL DATA GLOSSARY