When viewing horse form or prior form tabs in the form book you can see some top line sectional metrics, like this
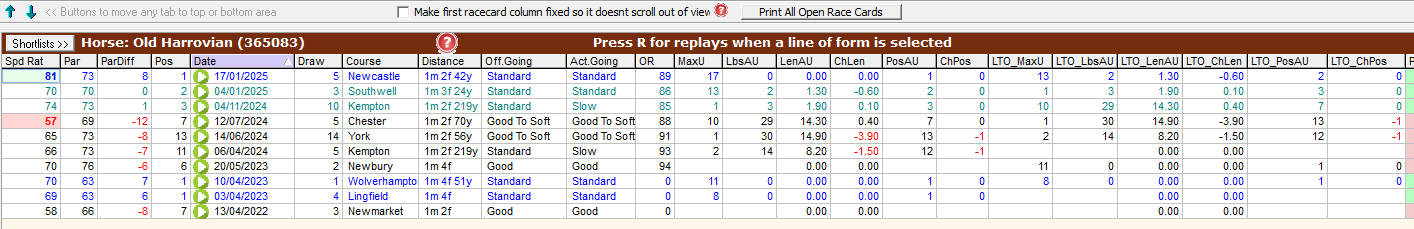
(Click image for larger version)
(NOTE: The fields will not be in the order shown. You can customise the field order by right clicking on any heading and choosing show fields from the pop-up menu which appears)
The sectional metric fields display are :-
MaxU - Max upgrade from last 4f, which is how many pounds they could have improved by running the section more efficiently (pounds)
LbsAU - Pounds (LBS) behind winner after upgrade
LenAU - Lengths behind winner after upgrade
ChLen - This is difference between the actual lengths beaten and the lengths after applying the upgrade lengths
PosAU - This is the theoretical finishing position after applying the upgrade
ChPos -This is the difference between the actual finishing position and the theoretical finishing position
LTO_MaxU - Last Time Out - Max upgrade from last 4f, which is how many pounds they could have improved by running the section more efficiently (pounds)
LTO_LbsAU - Last Time Out - Pounds (LBS) behind winner after upgrade
LTO_LenAU - Last Time Out - Lengths behind winner after upgrade
LTO_ChLen - Last Time Out - This is difference between the actual lengths beaten and the lengths after applying the upgrade lengths
LTO_PosAU - Last Time Out - This is the theoretical finishing position after applying the upgrade
LTO_ChPos -Last Time Out - This is the difference between the actual finishing position and the theoretical finishing position
We have created an excel document explaining all the data fields you can see in Proform, plus how far back the historical sectional data goes and the data tolerances we used to block obvious data errors coming into our database, you can download this on the following link:-
DOWNLOAD the SECTIONAL DATA GLOSSARY