

Why doesn’t the best horse always win?
October 29th, 2023By Keith Wright
NOTE: You can click on any image to view in a new window and you can download a PDF copy of this article on this link
Introduction
The usual answers are along the lines of ‘horses aren’t machines’ and ‘it’s just luck in running’ and sometimes ‘it’s just variance’. But this prompts two further questions – what is variance and how do we define the ‘best horse’? With regard to variance, there are better educated people than me who can explain it in greater detail but I would summarise it as the outcome of an event which is significantly different to the norm or expected outcome. Defining or identifying the best horse however is something about which we can each have a view and it’s this subjectiveness that contributes to the market position of each horse. A key element, often overlooked or difficult to identify, is where each horse is in its form cycle; this is one reason why a lesser horse can beat a better horse.
In this article I’ll attempt to illustrate how we can use various methods by which we might identify the best horse in any given race i.e. the best horse according to its form cycle. Of course, like anything in racing, this is not an exact science and the reader should have realistic expectations about what we might achieve in our pursuit of backing winners.
Let’s first address the issue of favourites because the favourite is the best horse according to the market. I’m using data from 1st January 2021 as I think it’s sufficient to illustrate the point and 2020 was the year of Covid when there was much disruption and plenty of strange results in racing.
The first image shows the result of backing every favourite (ignoring joint favourites) in all races. Unsurprisingly it shows a loss and the percentage loss is shown on the right under ROI Betfair. ROI simply means the Return On Investment.

When we break that down into race type we get the figures below.
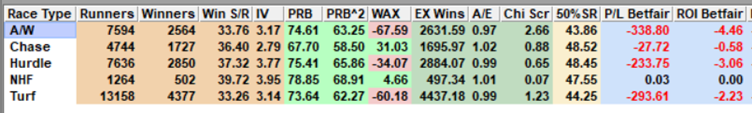
There’s a little difference across the race types but nothing far removed from the expected.
The point of showing this data is to illustrate that by backing the ‘best horse’ as determined by market forces i.e. the favourite, we will lose money. Even if we only back ‘steamers’ where the horse is persistently backed from the evening before all the way through to starting price, we make a loss overall and a negligible profit in NHF and Turf races.
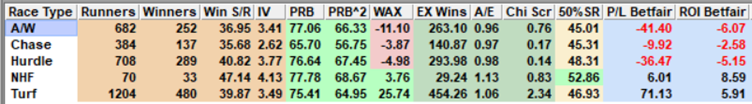
So to summarise the issue of favourites i.e. the best horse as determined by market forces, it’s clear they don’t always win (only 34.9% win as shown in the first image) and backing them all returns a loss.
Being realistic though, we wouldn’t (hopefully) be backing horses in every race and that’s out first advantage, we can be selective. The best (most suitable) races for the approach I will outline, are races of roughly 6 to 12 runners where they each have plenty of form; typically this would be handicap races but is not limited to handicaps if other races qualify.
The premise of this suggested method is that we accept horses aren’t machines and they do not perform consistently over time. There are one or two notable exceptions but a Frankel doesn’t come along very often. So if they do not perform consistently, our task is to identify when they are performing at the best (or worst) and if we can achieve this then we are a step closer to identifying the ‘best horse’ on the day and consequently we might narrow the field down to a small number of contenders. In other words, we are looking to identify where each horse is in its own form cycle. Remember, an average horse can beat a better horse depending on where they are in their respective form cycles.
It’s worth pointing out that this approach is not necessarily intended to be used in isolation, although it might be sufficient for some, but it perhaps should be used in addition to the reader’s usual selection method as a final check. It’s quick and easy and it can provide extremely important information in the final selection process.
I’m going to use a recent race as an example and I’m very aware of the ‘after-timing’ nature of doing this but I suggest if you follow the process you will find it can enhance your selection method.
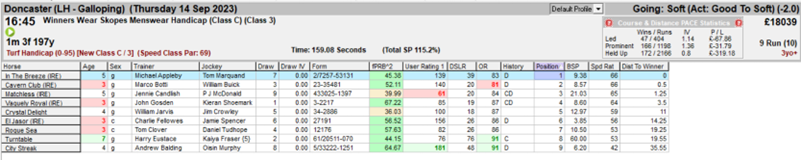
The race I’m using is the 4.45 at Doncaster on 14th September 2023, a Class 3 handicap with nine runners. The two horses with the least flat experience have both had five runs which is on the low side but sufficient for an opinion to be formed.
I’m going to use a feature called PRB^2 (Percentage of Rivals Beaten squared) which, as it says, shows how many rivals a horse has beaten in its previous races. It won’t tell the complete story of the past race but I’m of the view that as we increase the number of things we take into consideration when looking at form, we also increase the risk of misinterpretation. And as mentioned earlier, this method is best used as a final check of your selections already shortlisted.
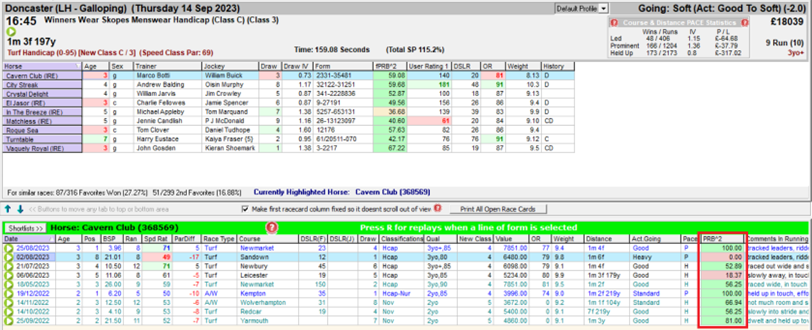
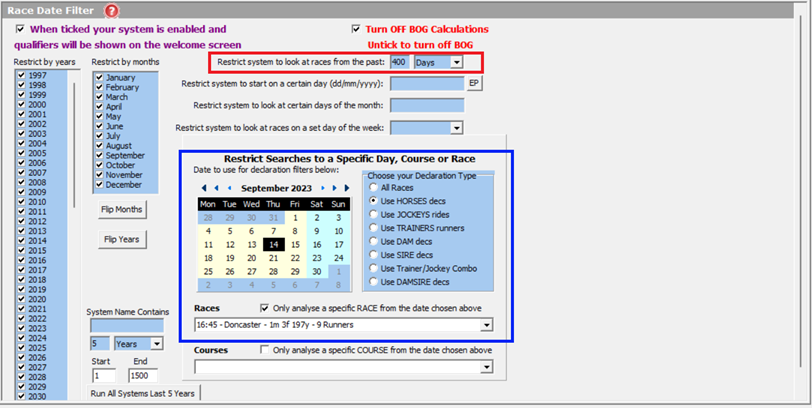
This is the Race Card view showing today’s race in the top half and the history of the highlighted horse in the bottom half. There are many other tabs and views available which can be organised to suit the readers’ preference.
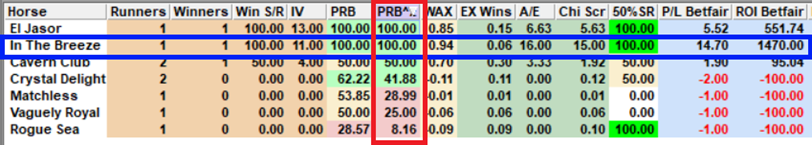
The history is organised newest to oldest and the PRB^2 column for each race is outlined in red. What I’m looking for is horses whose PRB^2 is improving in more recent races. Of course, we have to add context to the past races because a history of high value PRB^2 in lower quality races, on different going at a significantly different distance will have less relevance in today’s race. This is where the other columns help and should be taken into consideration.
I will work my way through the horses by selecting each horse in turn in the top half, trying to picture a trend of PRB^2 values.
The first horse highlighted above is Cavern Club who looks to be in a good phase currently, winning last time out but his Official Rating (OR) has gone up by 4 pounds to 81 as a result. We can see in the OR column in the bottom half that he has been beaten each time his OR has been above 77 so it’s possible that he’s reached his ceiling for the time being.
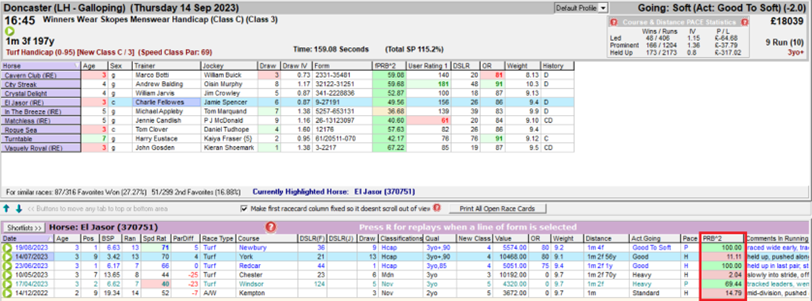
Favourite in the race was El Jasor who also looks to be in good form. However the bad-good-bad-good recent sequence can be explained by the figures in the Value column in the bottom half. The two poorer performances were in races where the race value was in excess of £10,000 and the two better performances where the value was around £5,000. Today’s race value is £18,039 (Top right) so there has to be a concern about this horse performing at this significantly higher level. Yet it was still assessed by the market to be the best horse in the race.
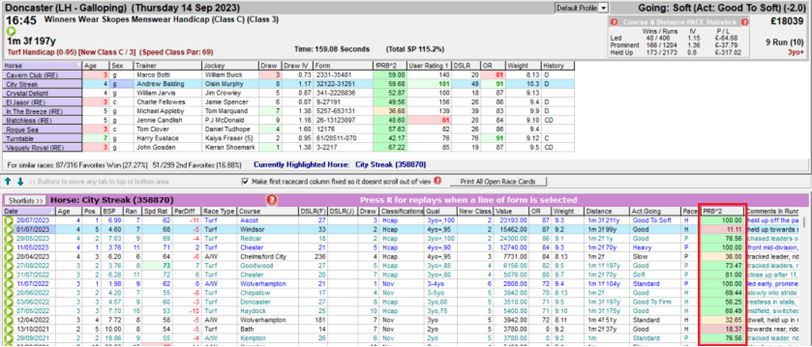
Second favourite was City Streak, another who seems to be in a good phase. In fact it’s difficult to ignore his claims in this race apart from one potentially significant factor, that of Days Since Last Run (DSLR).
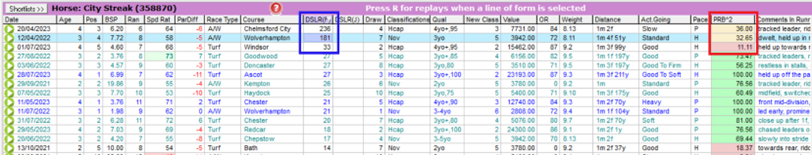
Simply by re-ordering the data in the bottom half by the DSLR column we can see that when the DSLR is greater than 30 as it is today, his PRB^2 values are significantly lower as shown above. It could be said this is easy to see after the event and it might not put me off backing it (I did back it) but the evidence is there and it’s easy to find if you have the right tools.
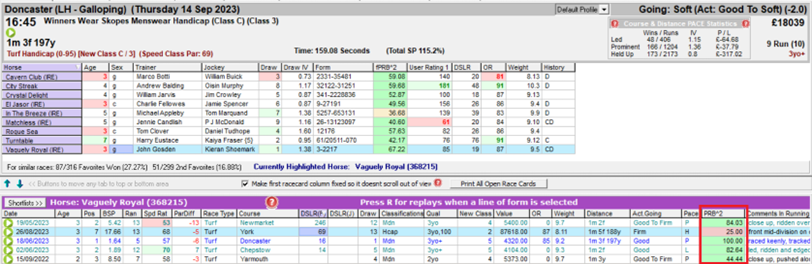
Next in the betting was Vaguely Royal who has been running well in lower value races and was highly tried in his first handicap run last time out. Difficult to assess because of that but noticeable that he’s been kept to better ground conditions so far, hinting the trainer might feel this is more suitable for the horse; the going at Doncaster was soft.
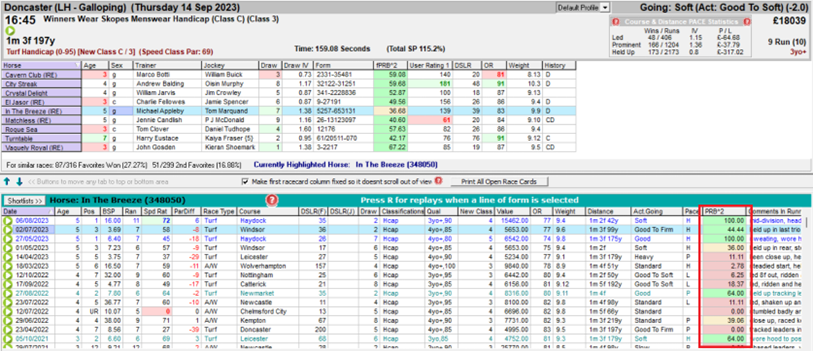
Next in the betting is In The Breeze. We can see his recent runs are really good from the PRB^2 values with the poorest performance being on what might have been unsuitable ground two runs ago. We can also see from the race Value column that he can perform at this level, something that most of his rivals in this race have not yet demonstrated.
We can also gain similar insight by using another feature in the Proform software package, creating a timeline analysis of the runners in the race in question. Personally I like to begin with evidence (historic races) from the last 400 days as this will capture the same race and meeting last year where one of todays horses might have run.
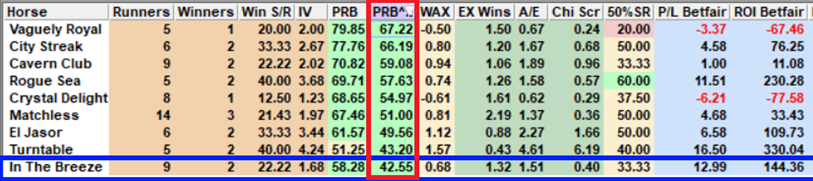
I will run this 400 day analysis then reduce the number of days and run it again in order to gain a timeline view of the figures for each of the horses. The benefit of doing this in addition to the previous analysis is that I can see the performances relative to each other runner and how their respective positions change over time when sorting by the PRB^2 column. Here are four views of the same analysis, the only difference being the number of days in the history, starting with 400, then 180 (six months), 90 (three months) and finally 45 (six weeks). These are the snapshots I’m comfortable with but depending on how much data is captured, I might look at other periods of time.
400 days
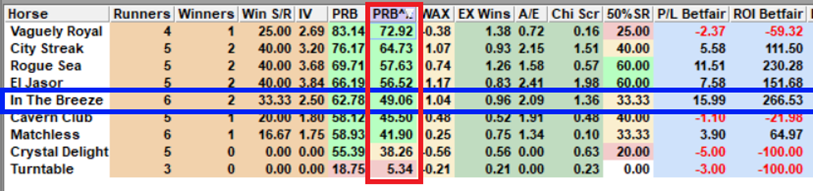
180 days
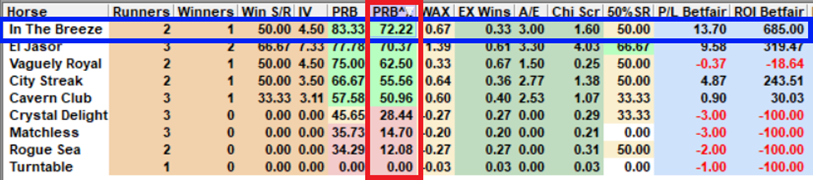
90 days
45 days
There are many filters we could apply to this analysis, for example we can limit the history to race class +/- 1 or similar going but as mentioned previously, this is not necessarily a good thing. The point is, it’s easy to do if we choose to do it.
From the four reducing time periods above, we can see the progress up the PRB^2 ranking of In The Breeze and also El Jasor. Interesting also to see the positions of City Streak who isn’t in the top three on the 90 day view and doesn’t have a run in the past 45 days (remember the point made earlier regarding DSLR for this horse). Notice also That Cavern Club is never far from the top and his four PRB^2 values are all in the green zone.
The result is shown below.
The key points which I hope the reader can infer are as follows:
- Horses perform in cycles which can vary significantly
- PRB^2 can be a reliable performance metric (along with other metrics in the software)
- Past races should be viewed in the context of today’s race
- Over-filtering can create distorted analyses
- The methods described above are best used as complimentary to your usual selection method
by Keith Wright
Involved in racing as a serious hobby for more than thirty-five years, always believing there’s a holy grail; there isn’t. What there is, in my view, is a set of tools, strategies & methods which enable us to get nearer to sustained profitability and greater enjoyment.
My background is engineering and more recently delivering ‘software as a service’ to the public sector.
I’ve done quite a bit of work on dosage (using breeding to determine a horse’s likely distance preference) and I’ve had one or two notable successes. I’m now part of a small team researching new angles using various analyses with a focus on being agile enough to adapt to the rapidly changing form cycles of horses.
The single most important thing I’ve learned about backing horses is to have realistic expectations. Even bookmakers have losing days and we will have more than they do. So long as we expect it, accept it and manage it, then we’ll be okay.
