First Time Handicappers – Myth vs. Reality
April 14th, 2024By Keith Wright
NOTE: You can click on any image to view in a new window and you can download a PDF copy of this article on this link
Introduction
For many years there’s been an awareness and a sense of suspected skulduggery about horses running in a handicap for the first time; more accurately, these suspicions are often directed towards particular trainers. It’s particularly frustrating when you see a horse finish out of sight in its first three runs and at odds that suggest not a single person has backed it, then it goes and wins as a red-hot favourite first time in a handicap. For those not familiar with handicapping, a horse will usually need to run three times in non-handicap races in order that it can be assessed by the official Handicapper and given a rating. This rating is know as the Official Rating and you’ll see it referred to as the OR. Ultimately the OR will determine how much weight each horse carries in a race in relation to the other runners and the logic is that a lower rating = lower weight = better chance of winning. So, if a horse runs poorly and the handicapper gives it a low OR, it will carry less weight compared with its rivals who have higher OR’s.
It's easy enough in Proform to test some ideas around first-time handicappers and for those who want to get into more detail and build their own tools, the export function gives you all the data you’ll need.
As an example, if I want to see all the first-time handicappers running today, I’ll just create a system in the System Builder. I’m going to refer to First Time Handicappers as FTH for the rest of this article.
The first thing to do is to identify those horses running in a handicap for the first time today and it’s best to deal with race codes (Flat or National Hunt) separately and even race types (e.g. Flat Turf or Flat AW) separately to ensure we get the all the correct horses. Today’s race will need to be a handicap, so we go into the System Builder screen and in there we choose the Race tab, and we select the race code/type and handicaps by ticking these boxes. So, ticking these boxes will show me only the horses running in a handicap on Turf or AW.
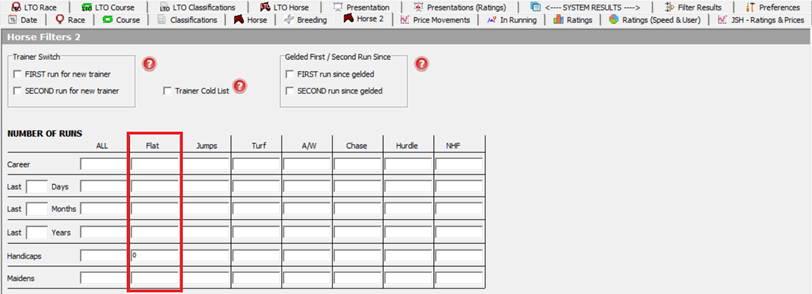
Then to ensure we only look at horses who have not run in a handicap previously in these race types, we go into the Horse2 tab and enter 0 (zero) into one or more of these boxes, in this case the Flat race column and the row called ‘Handicaps’. This is where you need to be aware that horses running in a handicap hurdle today for the first time might have previously run in a flat race handicap. I’m going to continue with flat races for this example so my entry into the Horse 2 tab would be this.
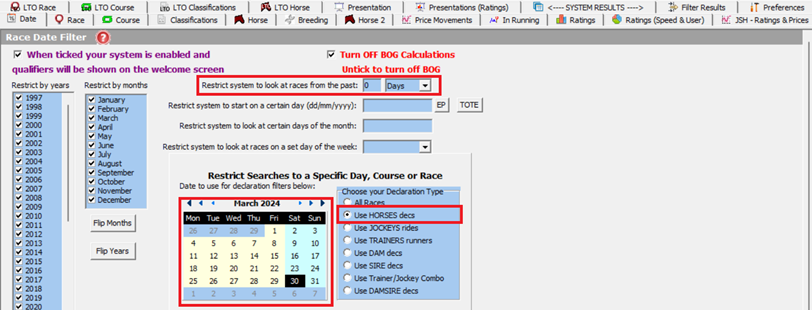
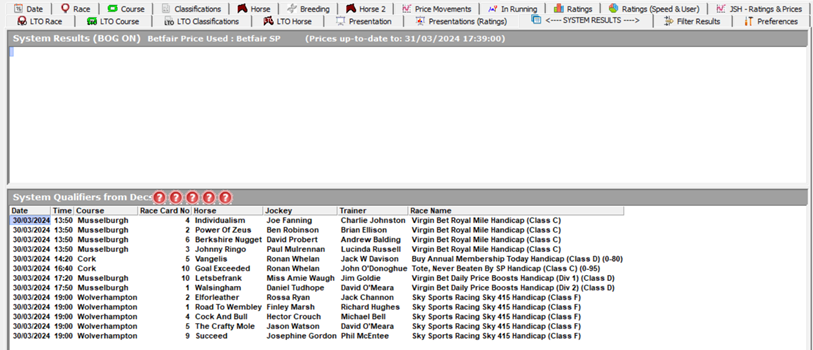
I’ve now gone to the Date tab, and I’ve chosen today’s date in the calendar, selected 0 days from the past (because I’m only looking for today’s first FTH) and then ‘use HORSES decs’ to show me the names of horses rather than trainers or sires & dams for example. And I get this.
There’s nothing in the top section because this is where horses from past races would appear and I’m not looking for them at this stage. But today’s first-time handicappers in FLAT races are shown in the bottom section.
Anyway, that’s how to access FTH but what we’re interested in is how to find out which trainers’ horses improve the most (or least) when running in a handicap for the first time.
I’ve created another ad-hoc system just looking at FTH in Hurdles races in January 2024, but I’ve used Race Code in the Horse 2 tab (a zero in Hurdle and Chase) so it will give me only horses that have not run in a handicap in either of those race types. That’s just personal preference. I could look as far back as I want to and can export all the data to work with as I like but this sample is just for illustrative purposes. The bottom line, backing all Hurdle FTH in January 2024 produces a loss of 23.04 points at Betfair SP and a greater loss at Industry SP.
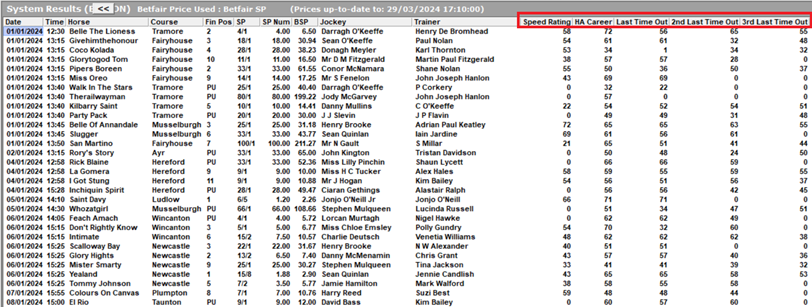
We can display the breakdown for these runners and here it is.
This shows the results and some other data for each of the FTH horses but of particular interest are the highlighted columns which give us the Proform Speed Rating for the race shown but also the career best speed rating and the speed ratings from each of the last three runs.
If I just concentrate on the winners for now, I get this.
I’ve sorted the Career best Speed Rating (HA Career) in ascending order i.e. lowest/worst at the top. What we see here is that the first horse, Goguenard, has a career best figure of 43 but managed to achieve a 71 when running in a handicap for the first time. Also notice some of the other huge improvements as we work down the list; 50 to 67 and 56 to 71 twice. If nothing else, this might encourage us to watch out for horses from these trainers when they run for the first time in a handicap. The caveat to using speed as a metric of performance is that fast horses can win slow races and get a low speed rating. However, it’s less likely a slow horse will win a fast race.
So, what this demonstrates is that by utilising the Proform data we can quickly gain an insight as to which trainers are capable of benefitting from the handicapping system. We could simply export this data for a whole year and with some simple spreadsheet maths we could quickly identify the trainers who make the greatest improvements.
But we can take things further and overcome the issue of relying solely on speed figures. I have my own ratings which produce an estimated OR for every run of every horse. Again, that’s been done by utilising Proform data via the export feature. I can upload my ratings into Proform and run the same analyses as above but if you don’t have your own you might use Racing Post ratings for example rather than go to the trouble of creating new ratings.
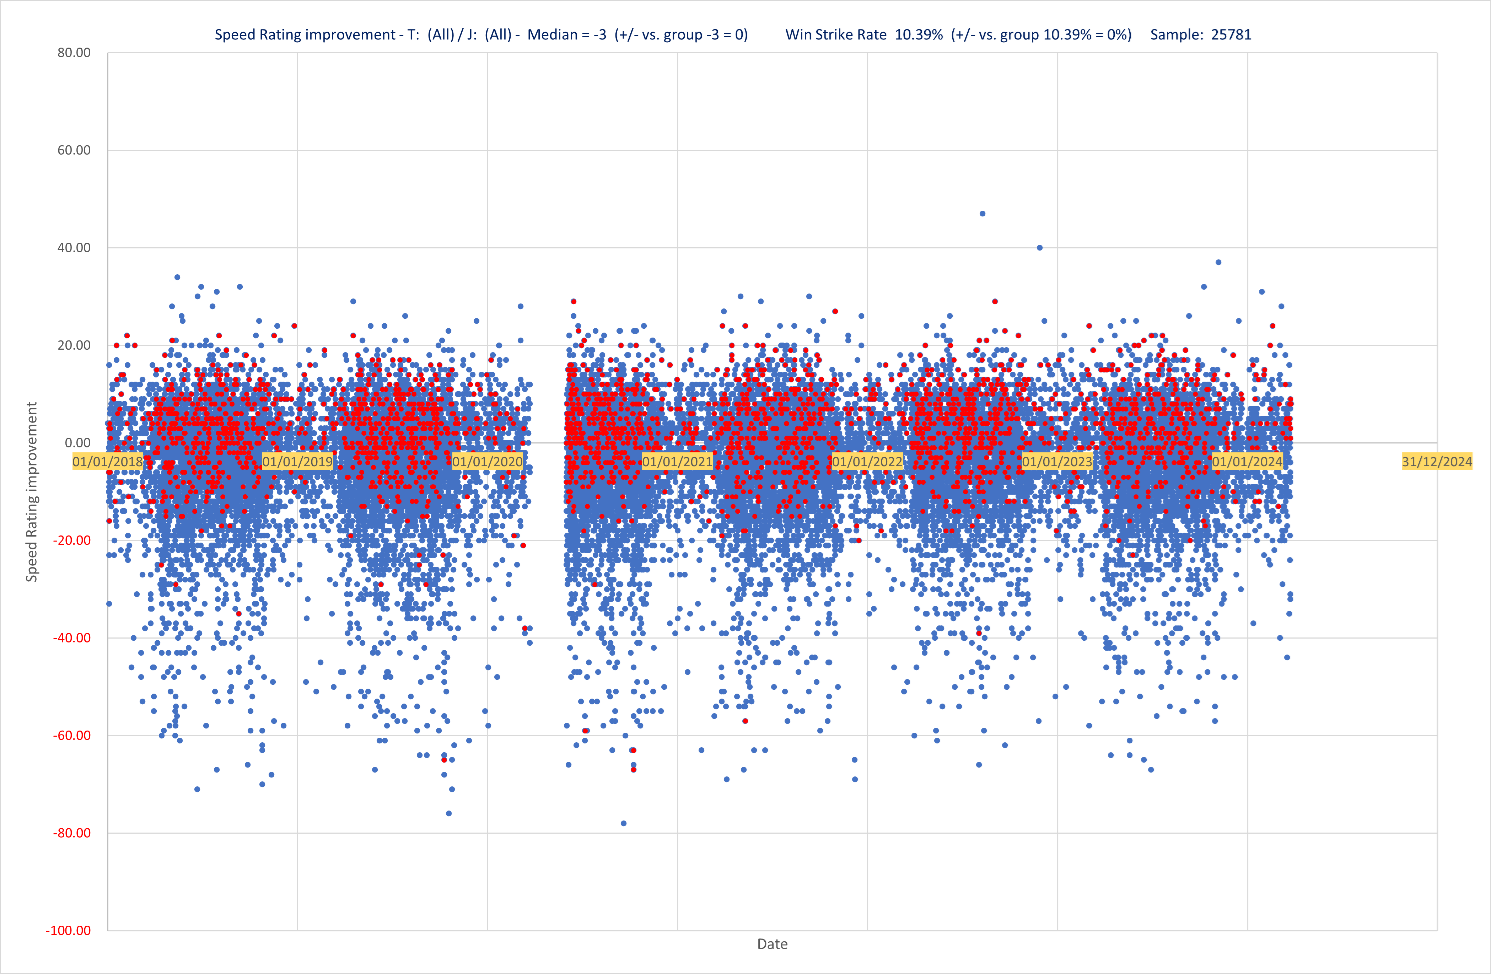
The ultimate goal is to establish some benchmarks against which we can analyse each trainer. Below is a representation of all FTH in Flat races since January 2018 with winners shown in red.
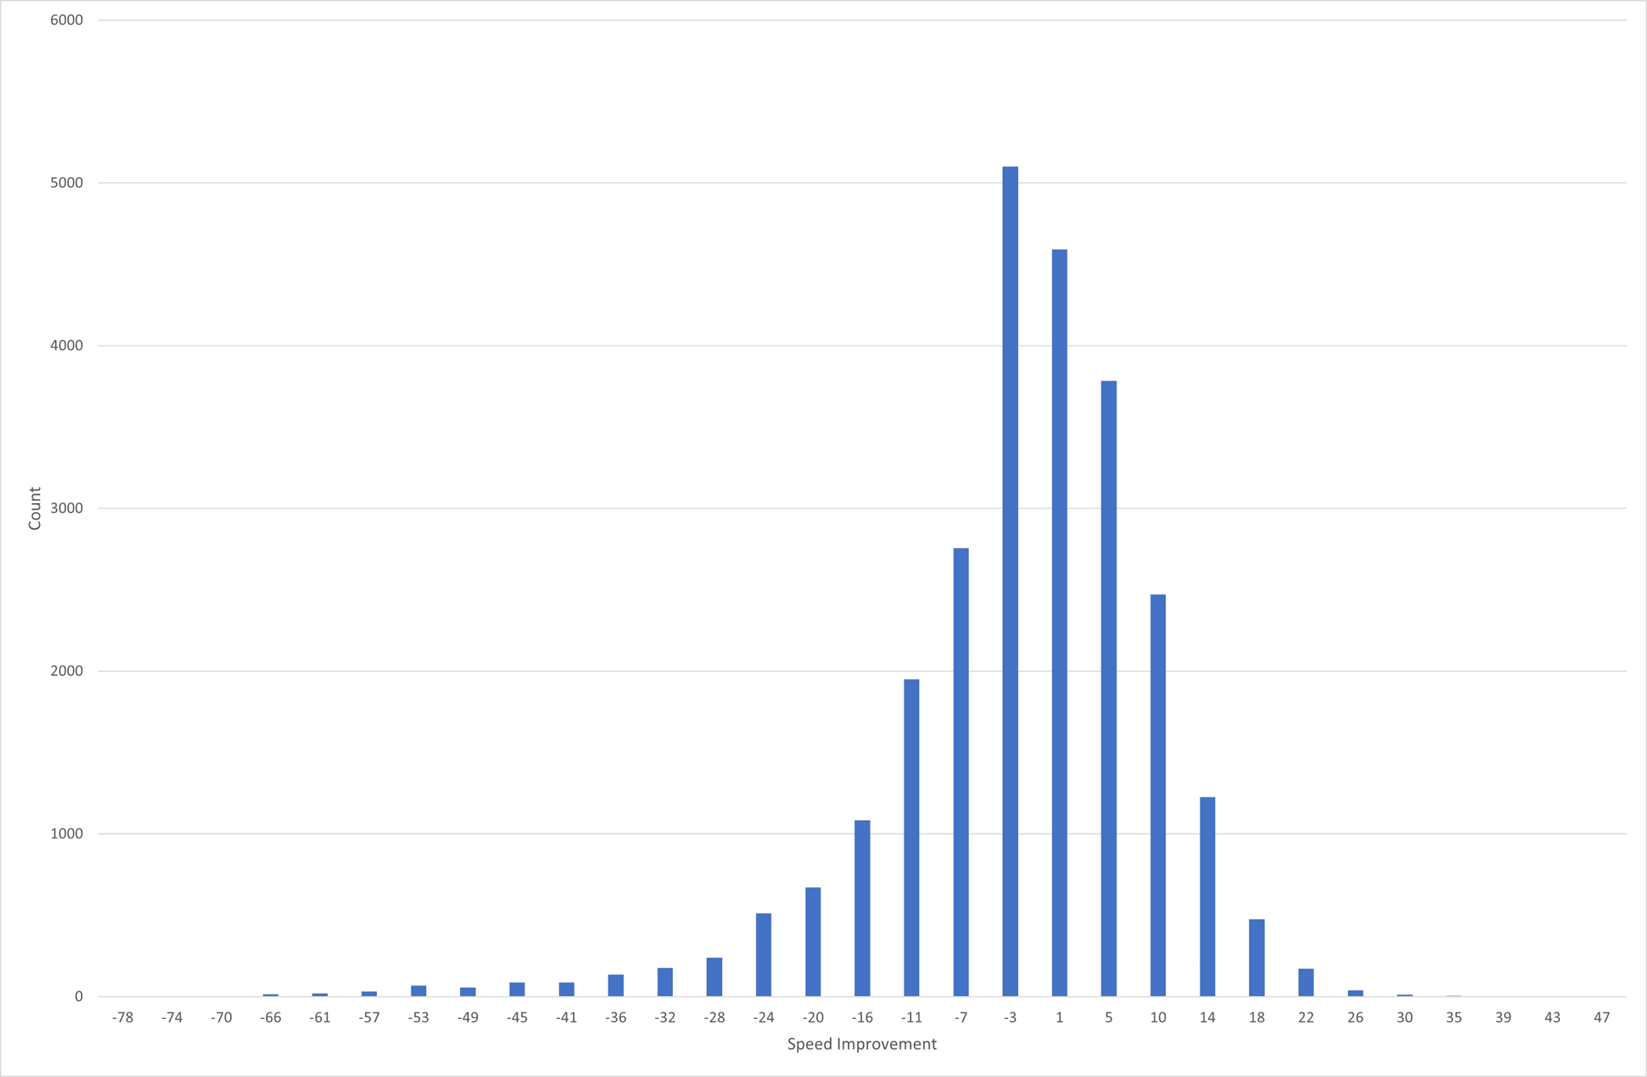
This tells us that the median improvement in speed rating is -3 from a sample of nearly 26,000. But we can also see that the range is pretty much between -30 and +20. That’s quite a big range and might not necessarily help us too much. The distribution chart looks like this, and the standard deviation is 11.58.
I’m certainly not a statistician but a fairly normal distribution like this is pleasing as it suggests that any trainers who have improvement figures towards either end of this distribution should be looked at in terms of doing much better or much worse than the norm.
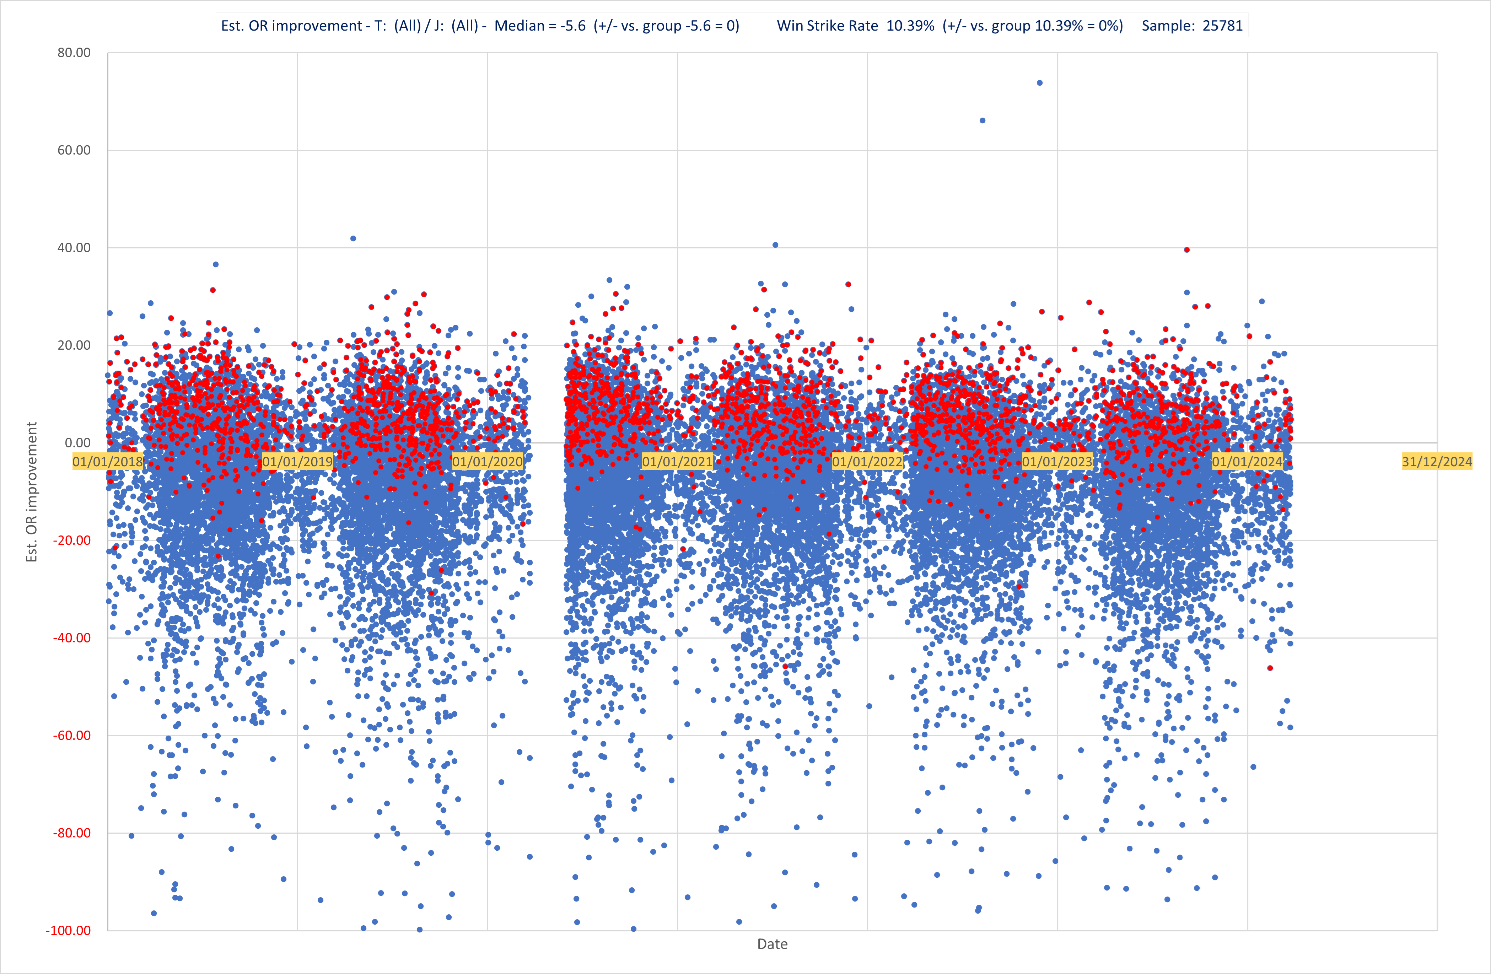
I’ll now show the same charts using my estimated OR’s
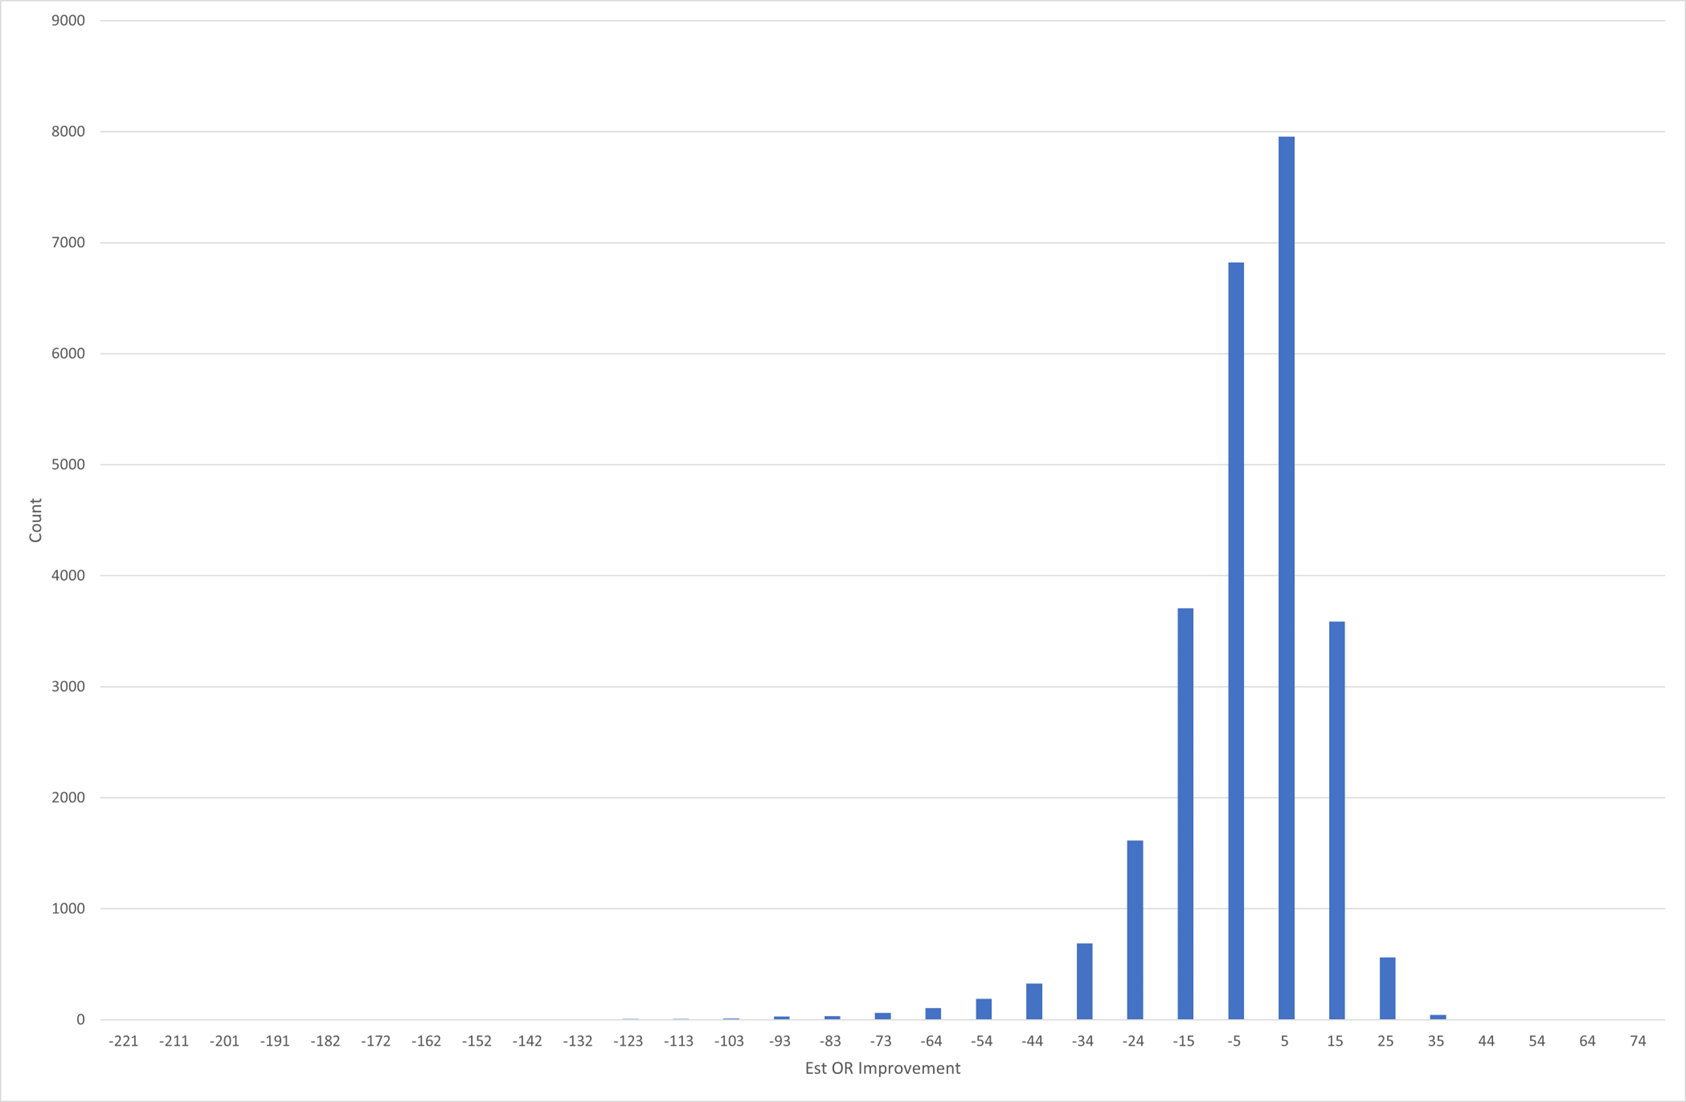
And below, the distribution with a standard deviation of 16.41
I’m happy that the two unrelated metrics appear to support each other but now we can dig deeper to find out who are the best & worst trainers when it comes to placing their horses in handicaps for the first time.
To do this I’m just using an Excel spreadsheet. Let’s take a look at a couple of well-known trainers.
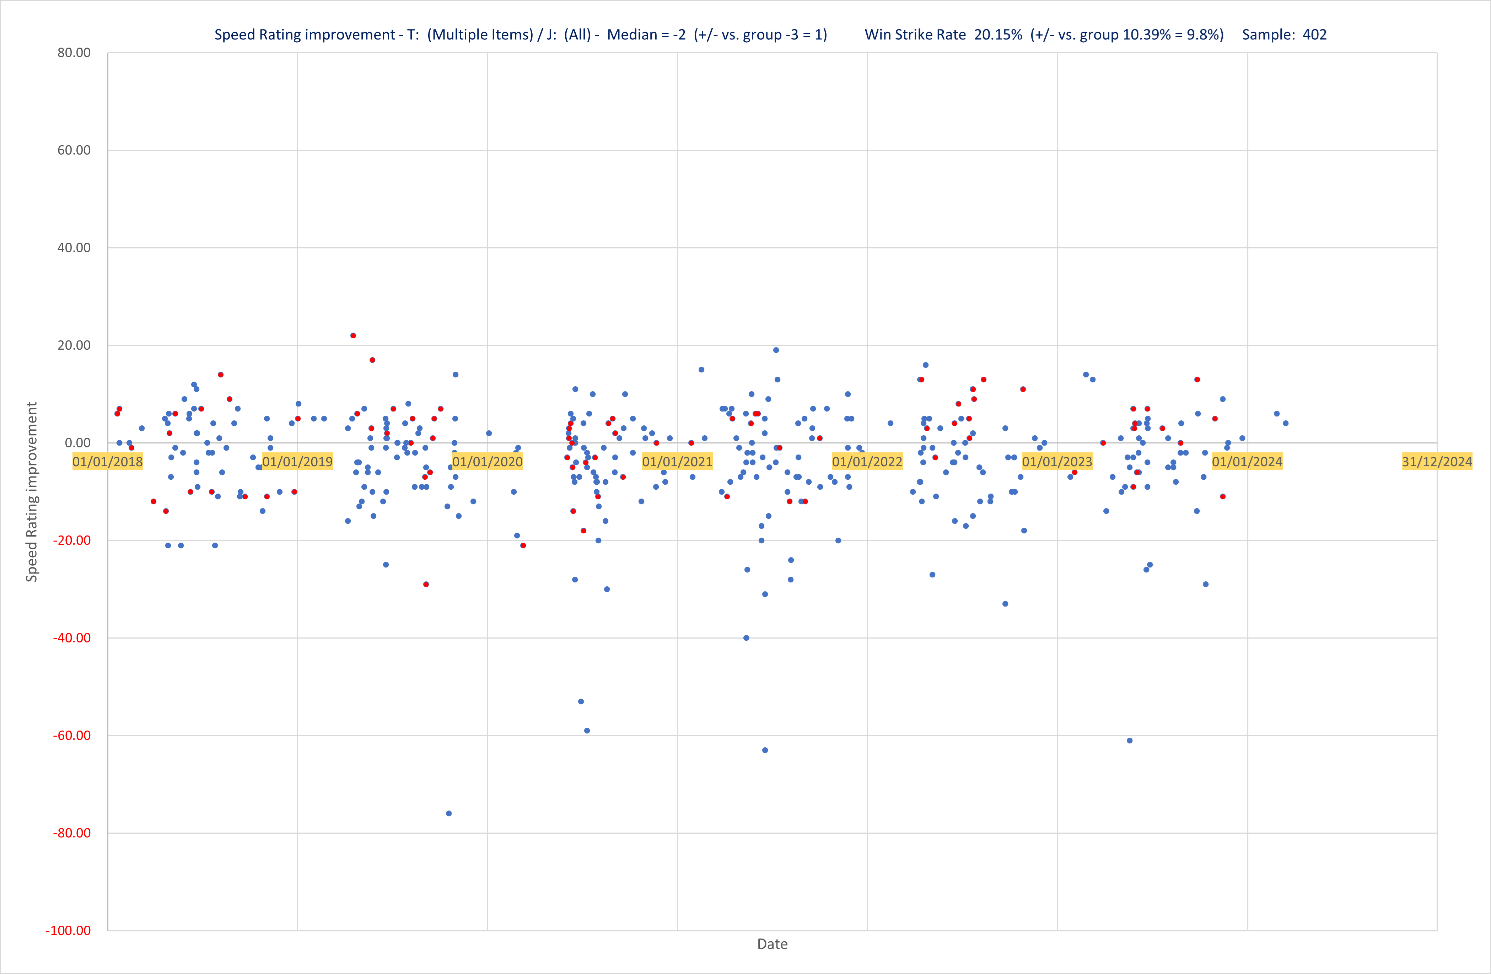
This is John & Thady Gosden who have a median improvement of -2 which is 1 better than the benchmark from the total population of horses. Their win strike rate however is 20.15% which is 9.8% better than the benchmark. This suggests they win more often than most trainers but that their horses have usually already shown their speed capability in their pre-handicap races.
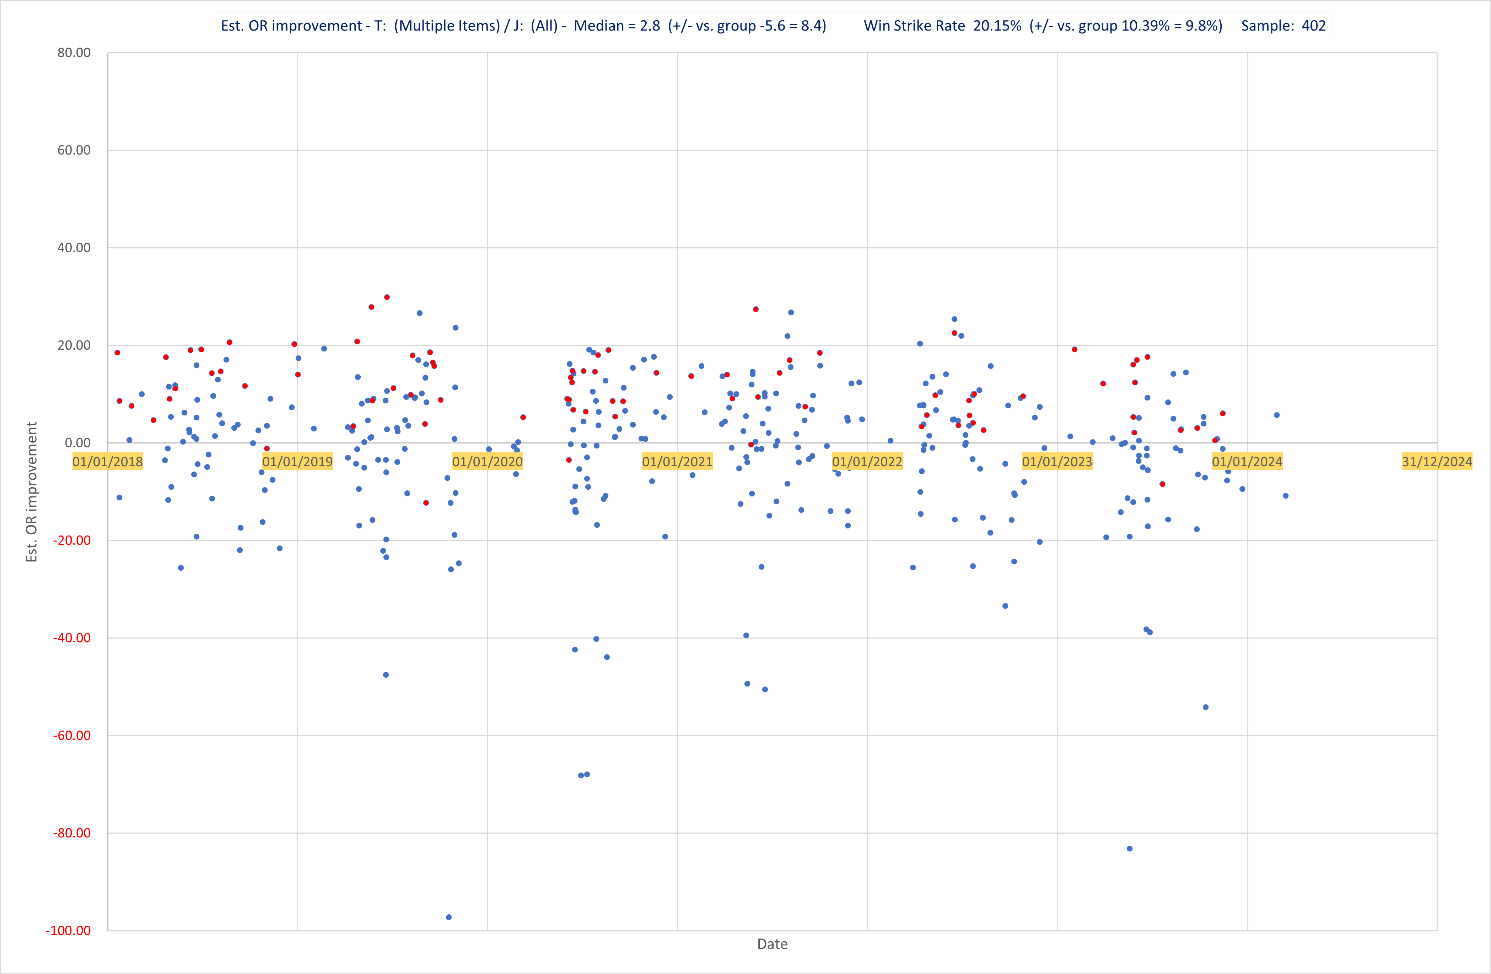
Their estimated OR chart however looks like this
Their median improvement of 2.8 is 8.4 above the benchmark median and that is significant. This suggests that whilst the horse’s speed capability is already known by the public, the trainer seems quite adept at placing their horses in the right races. Common knowledge perhaps but it’s reassuring that this data approach has some validation.
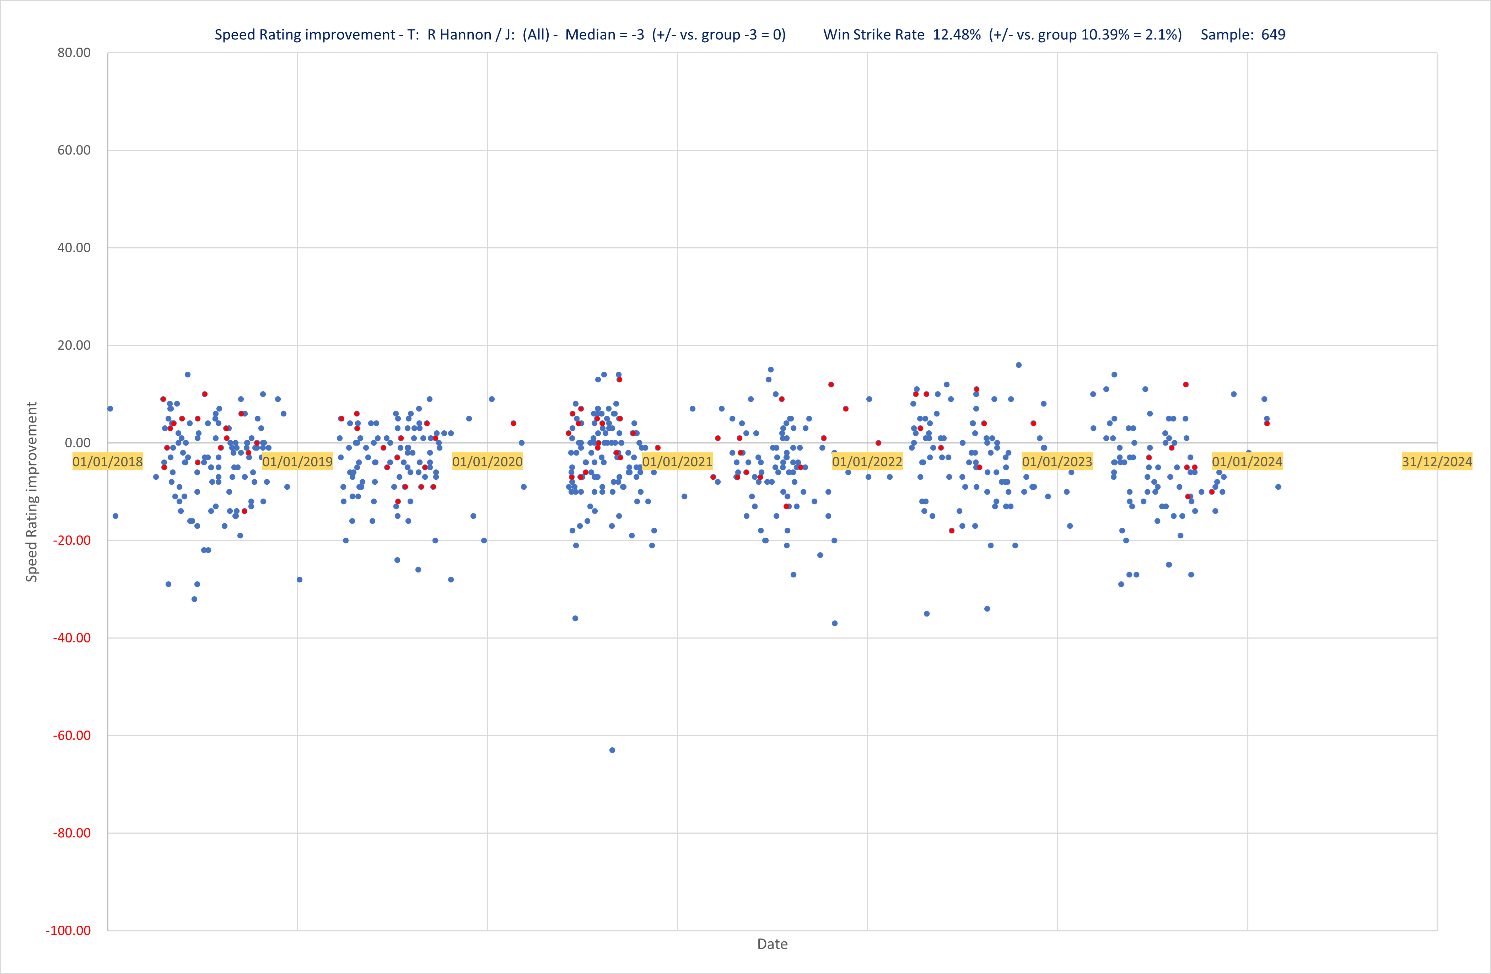
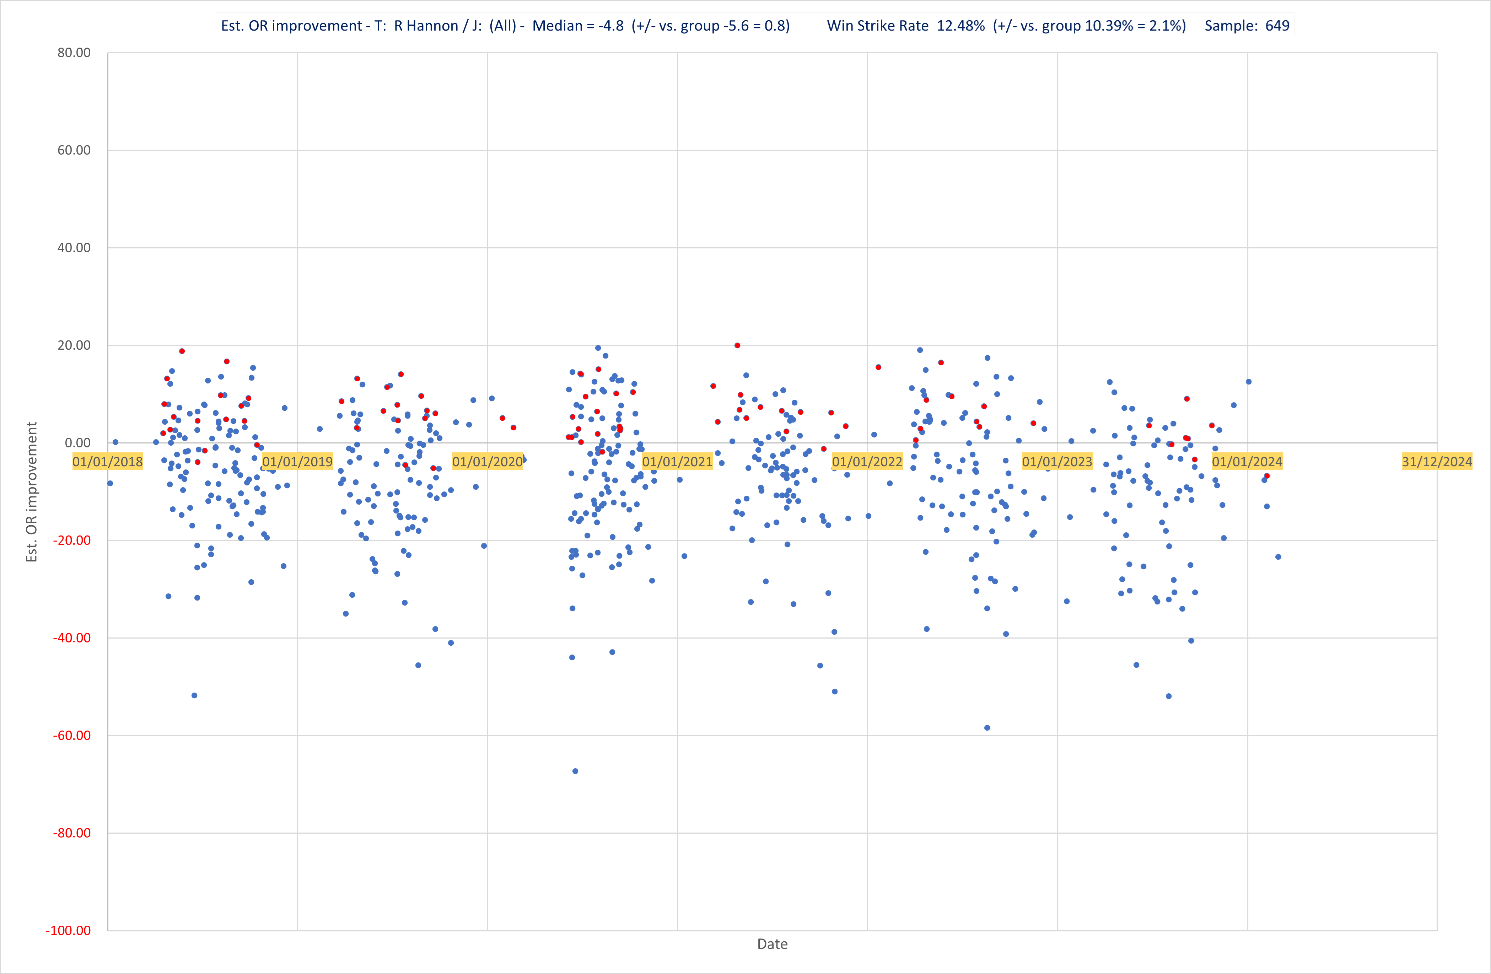
Here are the charts for Richard Hannon.
Basically, his horses are in line with the benchmark median.
But here’s how we can go even deeper and get something useful from the numbers.
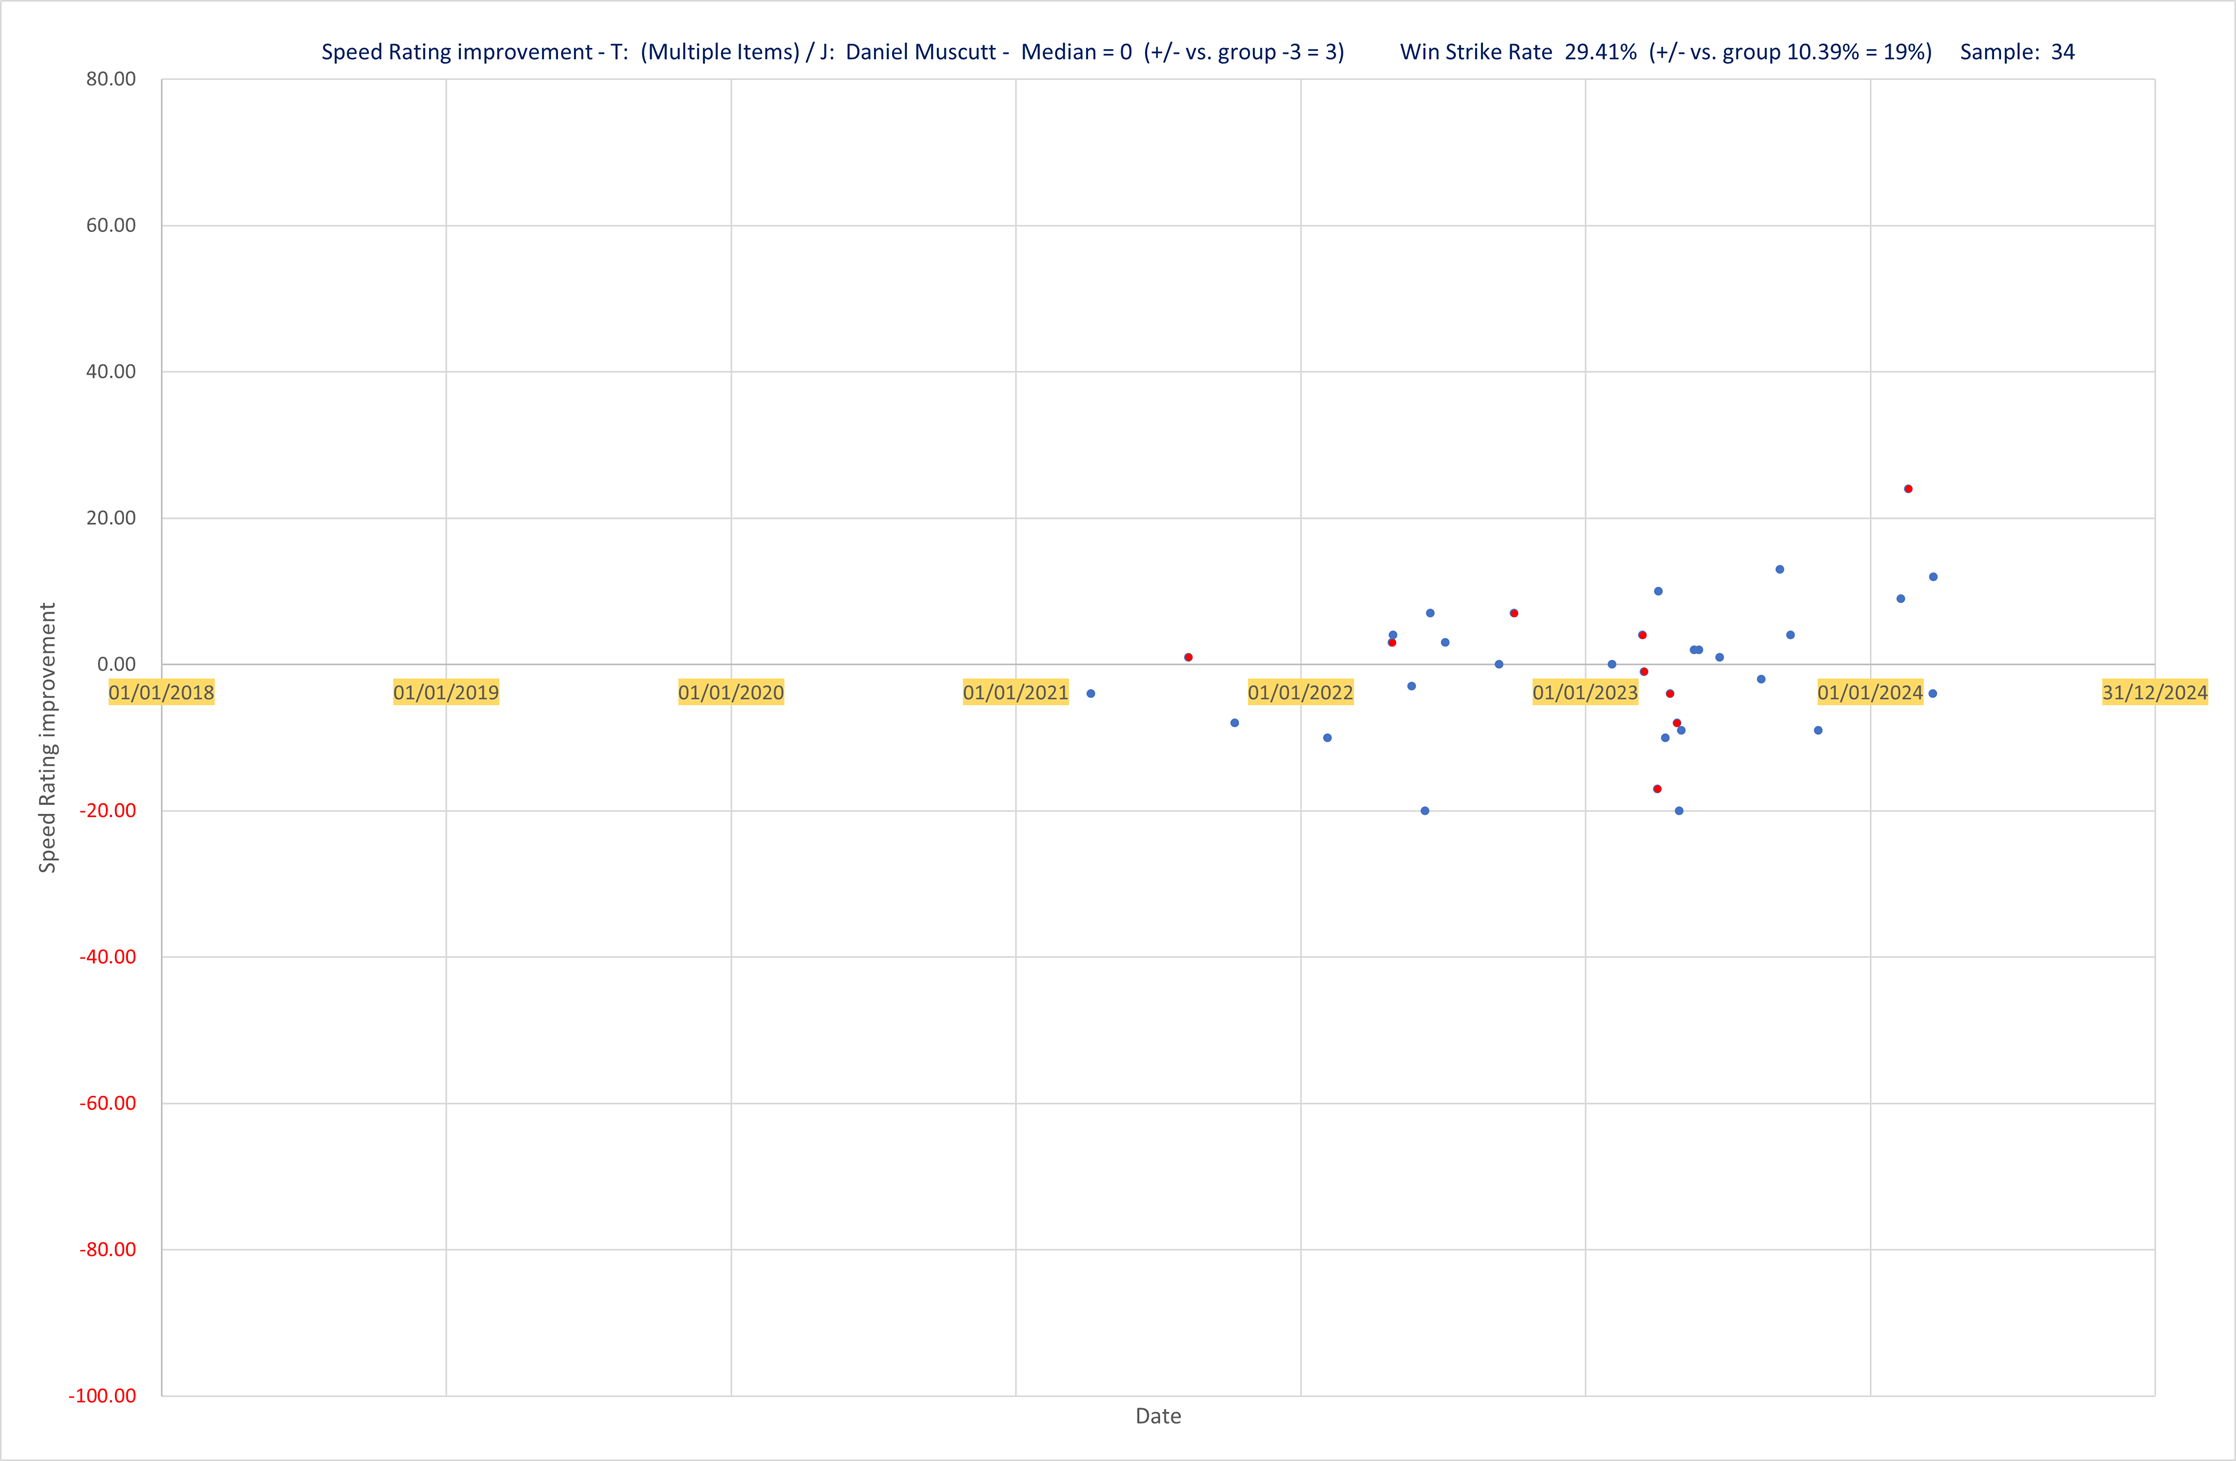
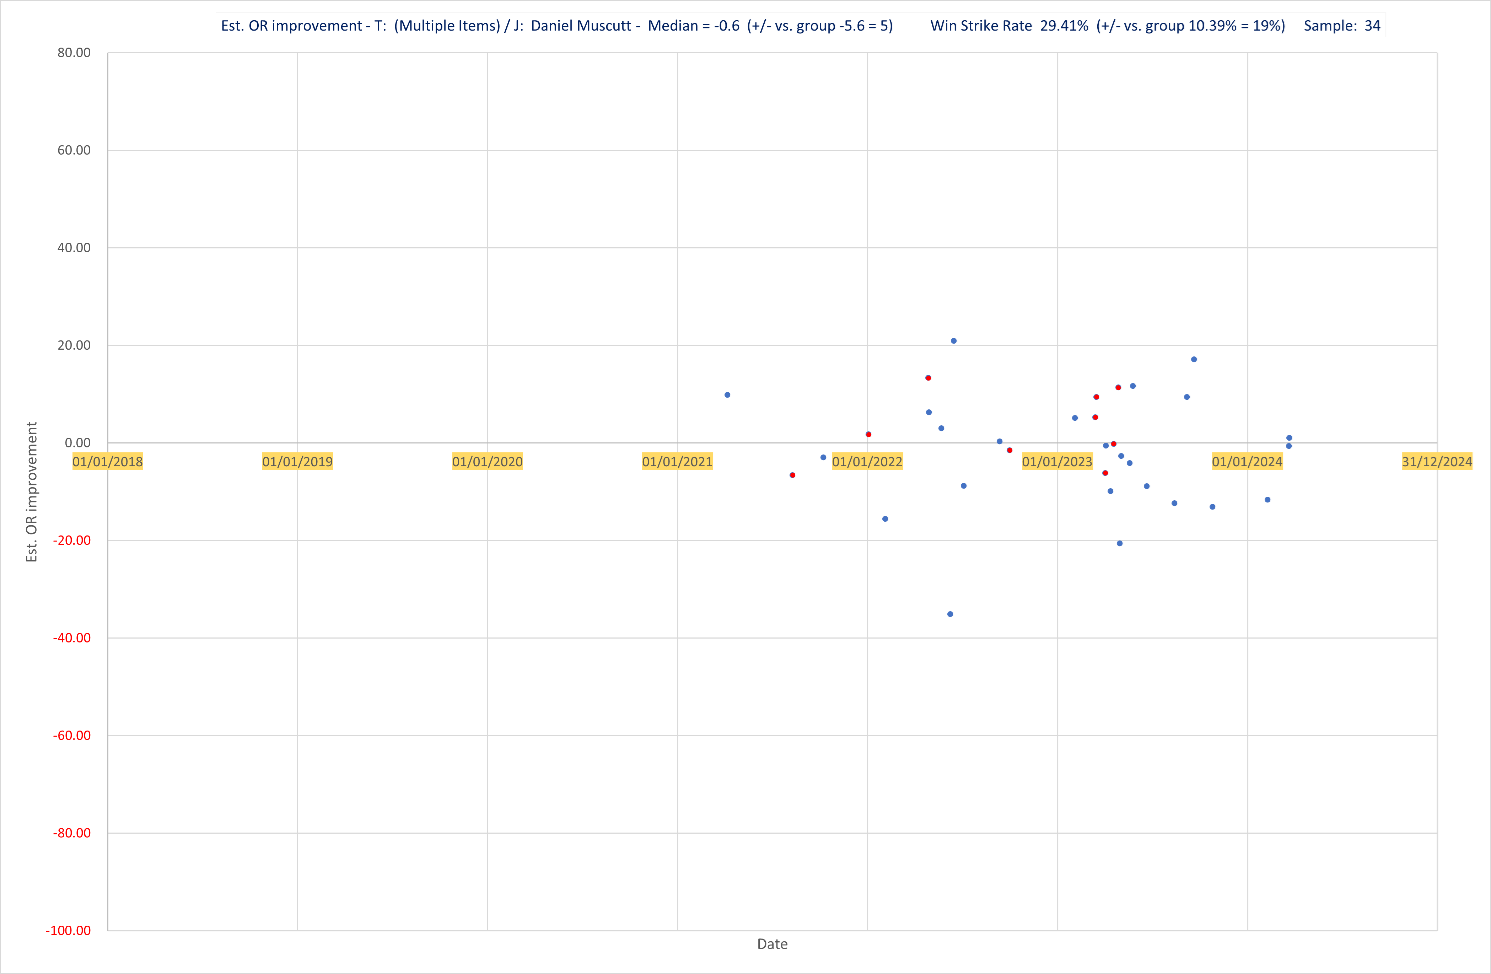
Here are the charts for J Ferguson with Daniel Muscutt riding.
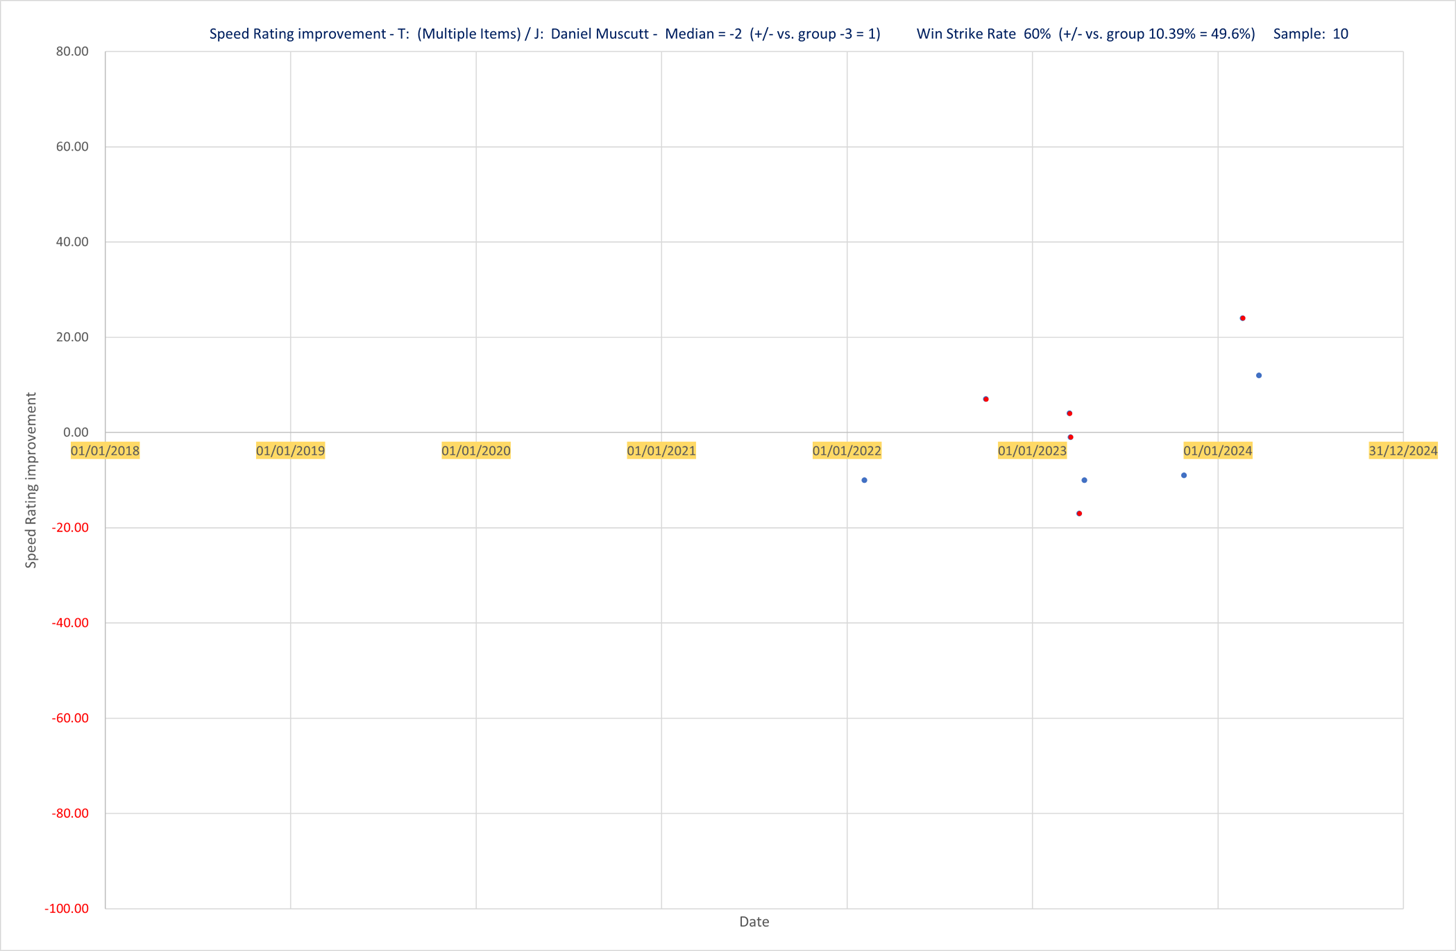
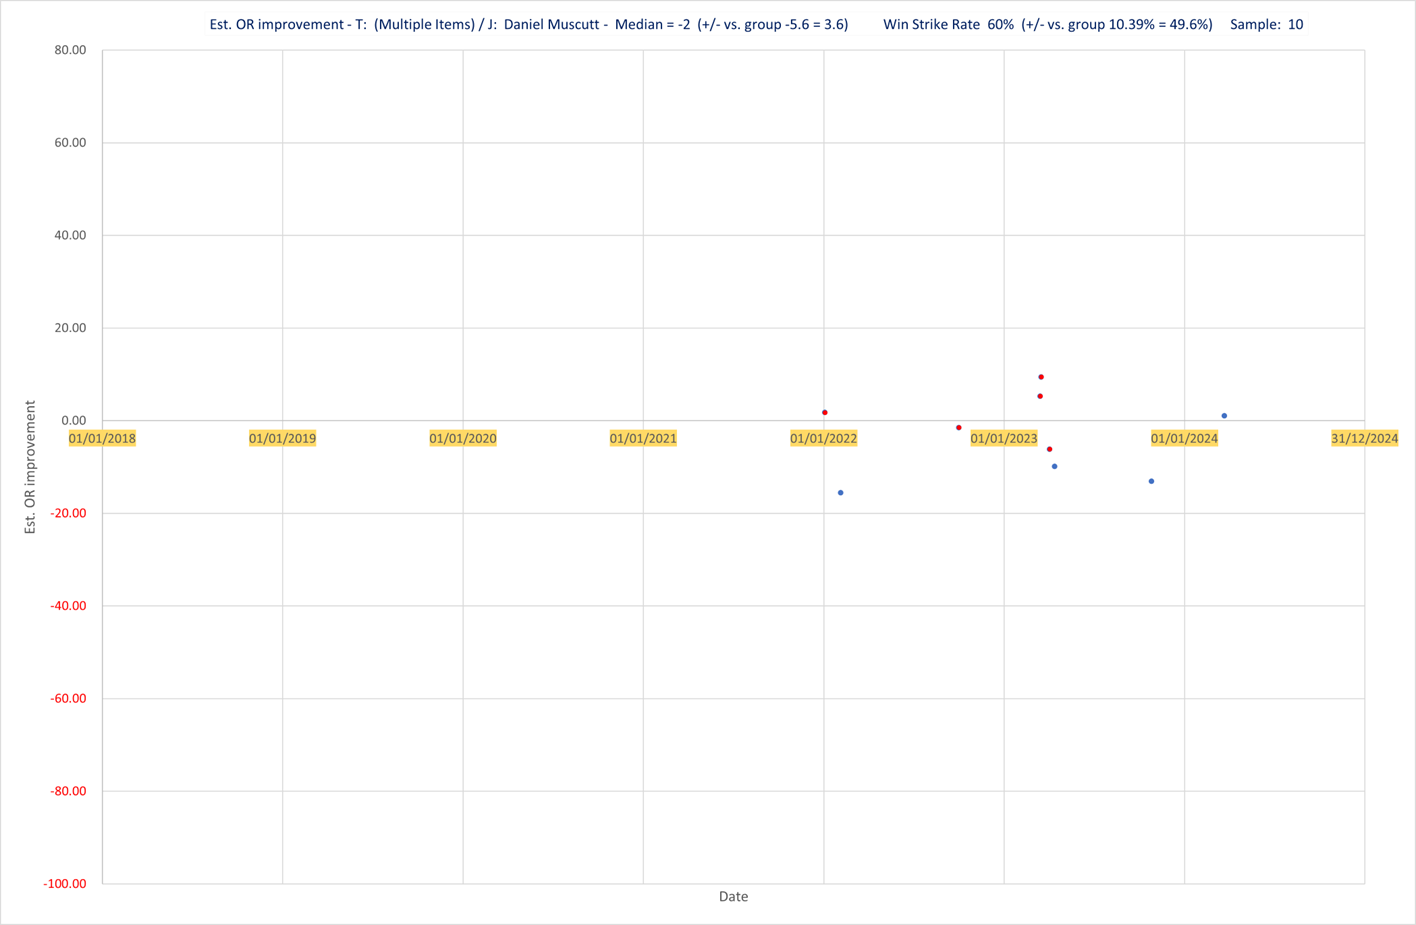
But if we just look at AW races at Lingfield, Newcastle & Wolverhampton we get this.
A strike rate of 60% which is 49.6% above the benchmark and with a speed median 1 above the benchmark and an estimated OR median 3.6 above the benchmark.
Those numbers suggest to me that his horses don’t need to improve much to win but when he sends them to those three courses with Daniel Muscutt riding, they are more likely to do well.
In summary there are definitely some trainers whose horses can improve significantly upon anything they’ve shown in their pre-handicap races. Similarly, there are some trainers whose horses rarely improve. The data is all there in Proform, as are many of the tools you need, and for those who prefer to create their own ratings and tools, the export feature gives you everything you need.
by Keith Wright
Involved in racing as a serious hobby for more than thirty-five years, always believing there’s a holy grail; there isn’t. What there is, in my view, is a set of tools, strategies & methods which enable us to get nearer to sustained profitability and greater enjoyment.
My background is engineering and more recently delivering ‘software as a service’ to the public sector.
I’ve done quite a bit of work on dosage (using breeding to determine a horse’s likely distance preference) and I’ve had one or two notable successes. I’m now part of a small team researching new angles using various analyses with a focus on being agile enough to adapt to the rapidly changing form cycles of horses.
The single most important thing I’ve learned about backing horses is to have realistic expectations. Even bookmakers have losing days and we will have more than they do. So long as we expect it, accept it and manage it, then we’ll be okay.


