

Speed Rating Angles at the Cheltenham Festival
March 6th, 2024By Paul Fitzgerald
NOTE: You can click on any image to view in a new window, and you can download a PDF copy of this article on this link
Introduction
I must confess to being almost exclusively a flat racing fan and punter, but of course the Cheltenham Festival is a week like no other. There isn’t a year that goes by where at this stage the proximity of four days of seriously engrossing sport hasn’t triggered my urge to seek out angles and value in Proform’s extensive jumps database.
An area that I’ve never looked at in too much detail is what happens with Speed Ratings in National Hunt racing, and at the Cheltenham Festival in particular. I come at this out of curiosity rather than with any great plan to begin with, in the hope the work may throw out some ideas and value for next week.
Proform’s database goes back over 27 years to 1997 and every runner in every race in it, (hundreds of thousands at this stage) has been assigned a Speed Rating, so there is a lot of data to go at.
Most Proform users will be familiar with the various Speed Ratings available in the software, but for those who are not; there are basically 6 main ‘Static’ ratings which are fixed in the Race Card view and will not alter when race card filters are applied. Static Ratings apply to today’s race code only (Flat - Turf and A/W are separated, as are Chase, Hurdles and NHF), so you’re looking at the runners Chase Speed Ratings only in the picture below. You can find all the information you need regarding speed ratings at the Proform Website…
https://www.proformracing.com/speed-ratings.html
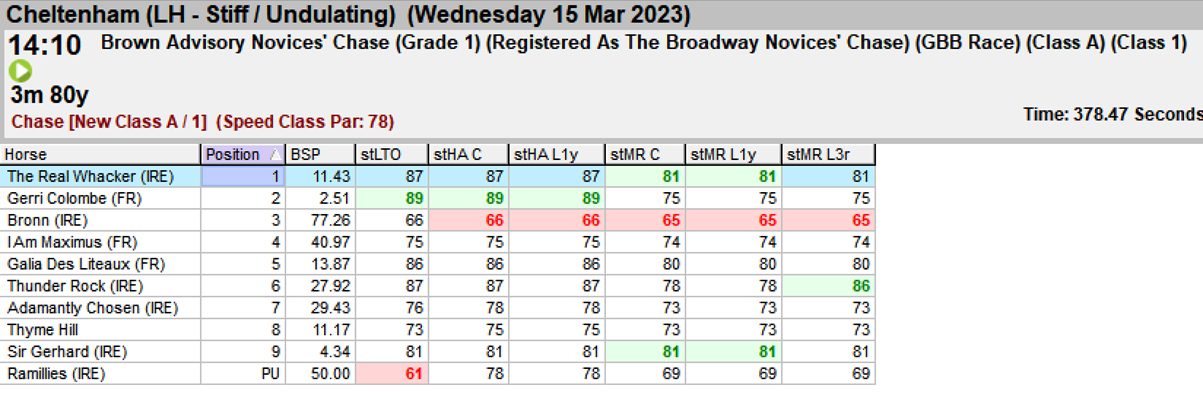
So to begin with I took a look at the Speed Rating I suppose our eye is most readily drawn to, namely the stLTO rating. This is the speed rating the horse achieved on its last run in a chase. The speed rating achieved in each runners last chase rating is ranked, and the results for the top stLTO ranks since 2013 at the festival are shown in the picture below…
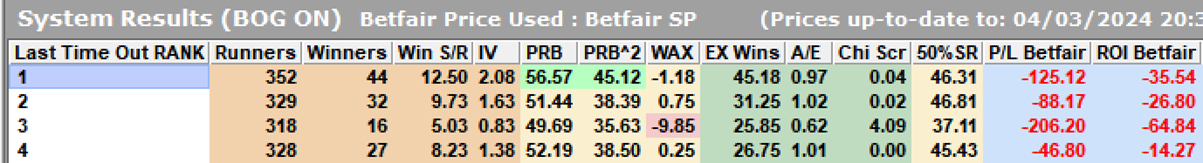
Yikes! When’s The Lincoln…?
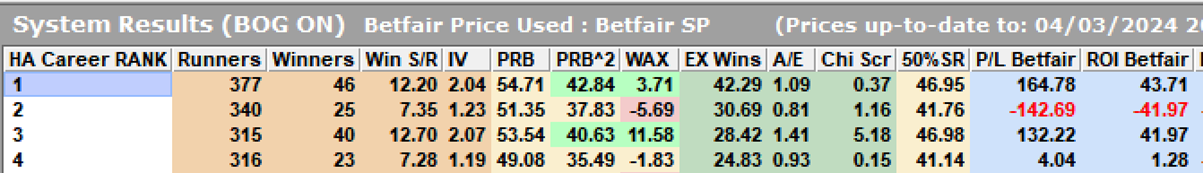
But then we pull up another rating set, this time the stHA C, where every horse in the race has its best career speed rating in chases ranked against each other and another picture emerges…we’re back in the game.
Given we have 6 main speed rating sets to work with, covering the horses entire career, which one is the best set to use. The set with best historical P/L returns so far? The set with the best strike rate but relatively poor P/L returns in preceding years? The set that did badly in the win market but did well in the place market?…etc., etc., etc., and in any event is using any of these sets individually for reasons of positive past performance, any guarantee they will continue to be positive in the future…we know where that ends.
So my thinking would be why don’t we try to use them all! All 6 speed rating sets offer some assistance in our quest to assess the overall ability of the runners in the race. Let’s attempt to calculate a SpeedPower Rating if you like. A rating that takes into account all of the speed rating data shown on the previous page.
Having decided we’ll use all 6, the next question is how will we join them? We could add all 6 together and come up with a number - e.g. Bronn from the previous page would be calculated as… 66 + 66 + 66 + 65 + 65 + 65 = 393) – but the potential problem here is we are giving each rating set an equal weighting. Where in fact the stHA C aka Highest Career Rating could have been achieved 2 years ago, whilst the stLTO could have been achieved last week. In all likelihood the figure from last week, and rating sets calculated from more recent speed figures are probably more relevant in our attempt at assessing the merit of each horse. So we will weigh them to take account of the differences in importance or relevance that each rating set brings to bear on our calculation. That happens in the next part of the process.
Calculating the SpeedPower Ratings
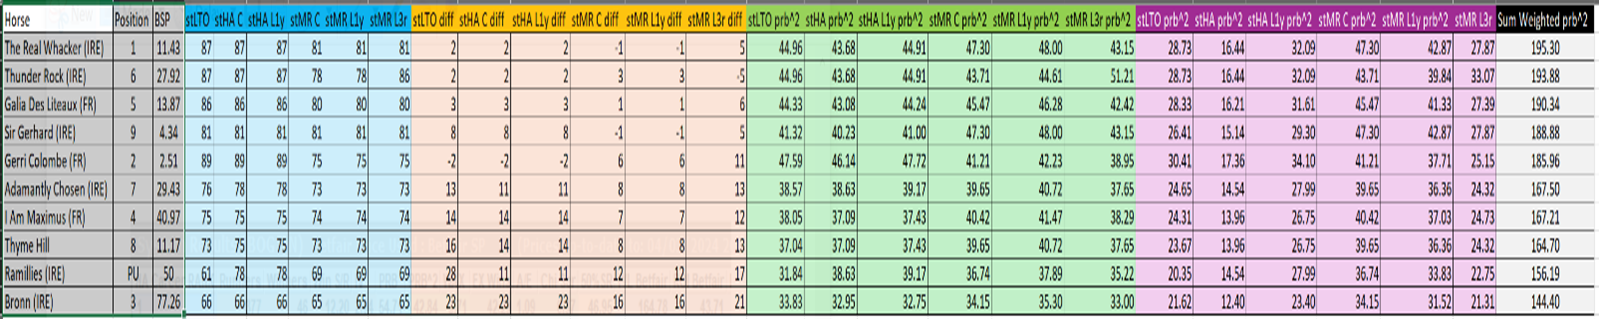
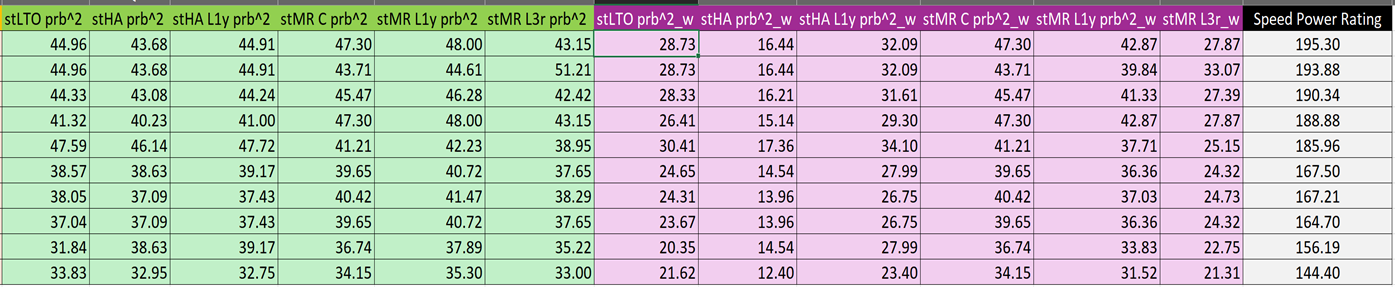
The nuts and bolts of our overall speed rating assessment happens on the spreadsheet below…
Let’s go through it step by step…
Part 1 – The data here is simply copied and pasted from the Racecard view in the Proform Software. They must be pasted in the order shown.
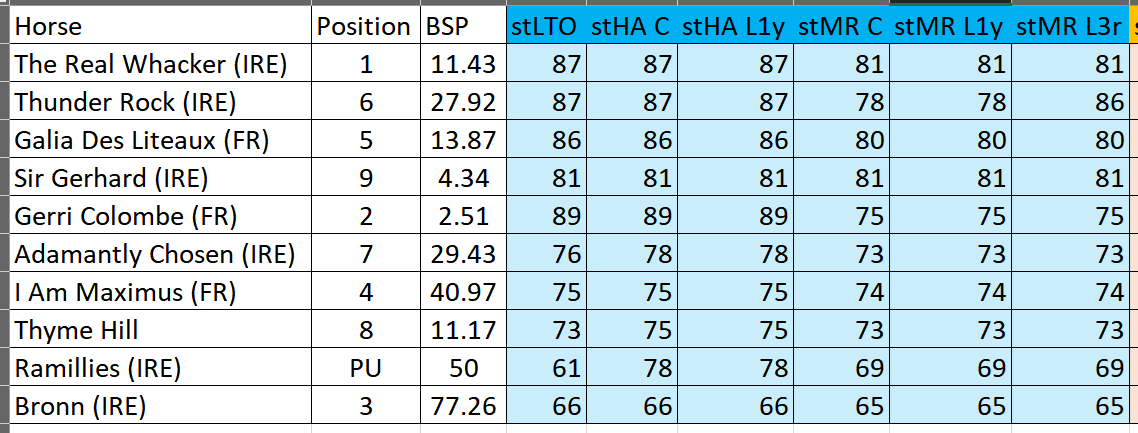
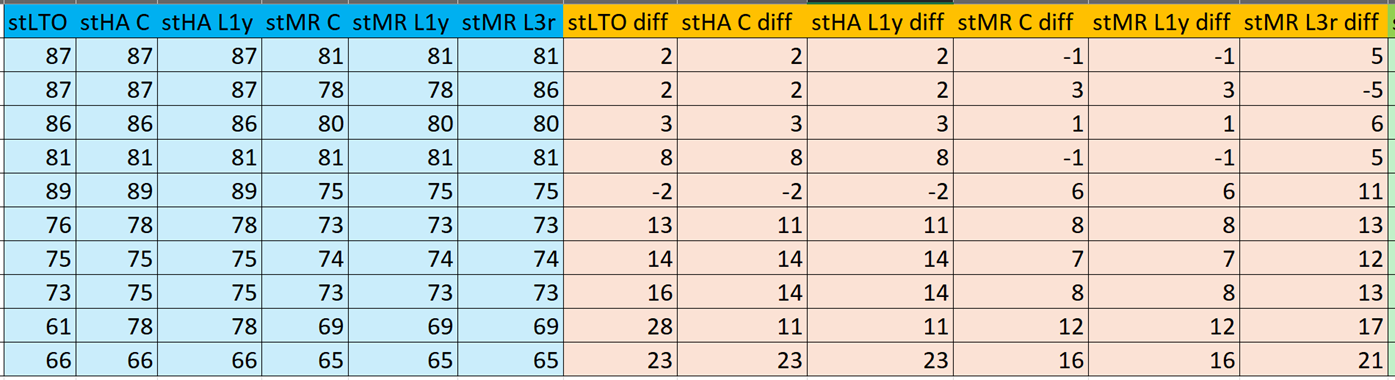
Part 2 The ORANGE section – Here an Excel formula calculates (1) how far the top rated runner is clear on speed ratings of the second rated horse. This is denoted as a negative value. For example in the stLTO column, Geri Colombe has a minus 2 (-2), as he is top rated on 89 in this rating set, 2 points clear of The Real Whacker and Thunder Rock both on 87. (2) For every other horse in the race except the Top Rated, their number is the number of speed rating points they are behind top rated.
For example Bronn gets 23 in the stLTO diff column as his rating of 66 is 23 points behind the Top Rated Geri Colombe on 89. And so on across the 6 rating sets in this section of the sheet. Treating the ratings in this way takes into account the variance that occurs within a rating set in any given individual race, rather than treating all ratings within a race as generic ranks.
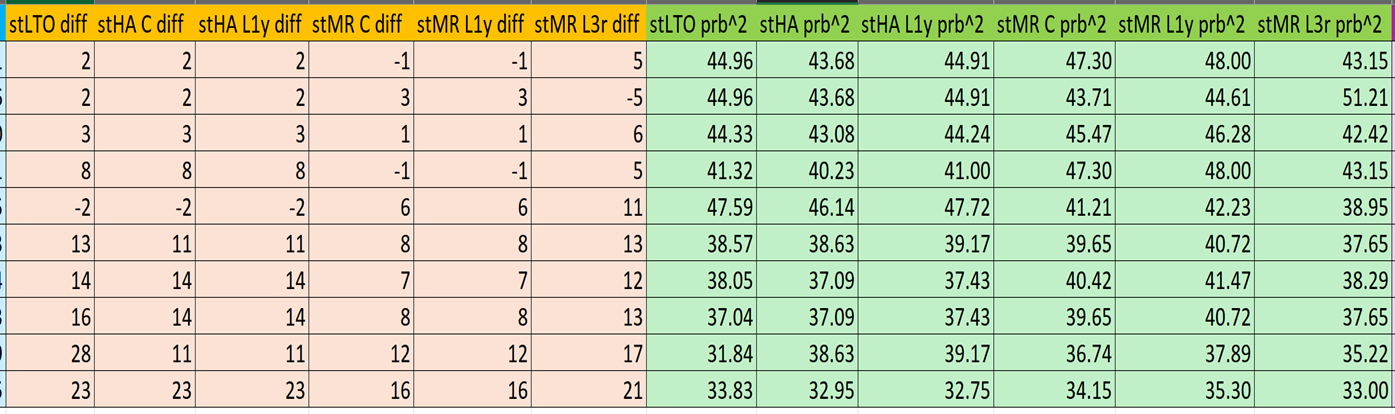
Part 3 The GREEN section
The term ‘PRB’ will be introduced next and is a concept that you will soon become familiar with in Proform, as it features extensively in the software. It stands for Percentage of Rivals Beaten. The problem with the traditional method of using wins and losses to measure finishing performance - better known as strike rate - is that it makes no discrimination between for example a horse that finishes 2nd in an eleven runner race and a horse that finishes 11th in the same race. They both receive a zero even though of course the horse that finished 2nd has performed better on the day.
Using Percentage of Rivals Beaten to measure finishing performance in the same race, the horse that finished 2nd has beaten 9 of his 10 rivals and receives a PRB of 90% or 90, whilst the horse that finished 11th has beaten none of his rivals and receives a PRB of 0% or 0. Hence a more reflective and better measurement of actual finishing performance is achieved. PRB2 simply expands on that to provide a smaller reward for positions further away from the winner than PRB does, making it even more reflective of finishing performance again.
Here we also get into some ‘Line of Best Fit’ and ‘Linear Regression’ action. “But its bloody horseracing”, I hear you say…
Anyway, it’s very basic statistics, not difficult at all. And all we’re using it for is to find a formula that will convert the numbers in the orange section to equivalent PRB’s in the green section. The formulas are already calculated on the spreadsheet so it’s all done for you already. If you’d like to know more about Linear Regression and Lines of Best Fit in Excel, the Statology website is a good source.
https://www.statology.org/line-of-best-fit-excel/
* For those more statistically literate - The fit on the lines plotted between the ‘diff ratings’ and PRB^2 had an R2 of 95+ in all cases i.e. a good fit. Separate regressions were done for Hcap Chases, Hcap Hurdles, Non Hcap Hurdles and Hcap Hurdles.
As an example here, Geri Colombe who was 2 clear on stLTO ratings, gets an equivalent PRB^2 of 47.59, whilst Bronn who is 23 points behind top rated gets an equivalent PRB^2 of 33.83.
Weighting the equivalent PRB’s
Next, we need to calculate an order of importance across the 6 rating sets, because as mentioned earlier its quite probable the influence that each individual rating is exerting across the set of 6 ratings is not equal. This is achieved through my own machine learning process and is beyond the scope of what’s being discussed here.
The results of that weighting process for Non-Handicap Chases can be seen in the table below. Median Career Rating (stMR C) comes back as the most important rating in a Non-Handicap Chase. For reference I’ve included order of importance tables for chases and hurdles, handicap and non-handicap in the spreadsheet that will be on the *Proform Telegram Members Group.
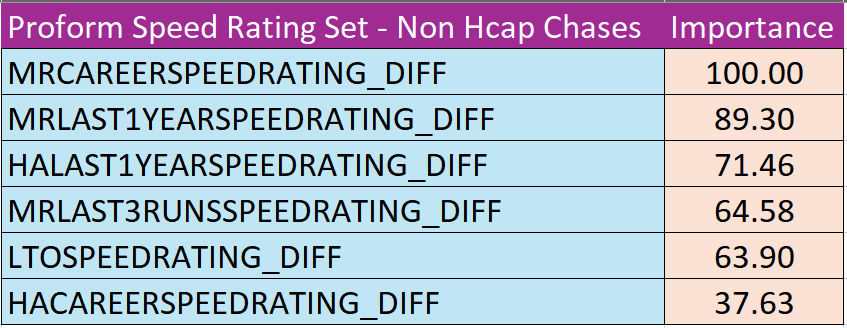
Once the weightings are calculated its then just a matter of multiplying each calculated PRB^2 from the green section by its importance number from the table above. Then we add all 6 together to produce a final weighted sum total rating, which we’ll call the SpeedPower Rating. These figures are calculated on the purple section of the spreadsheet.
Real Life Example
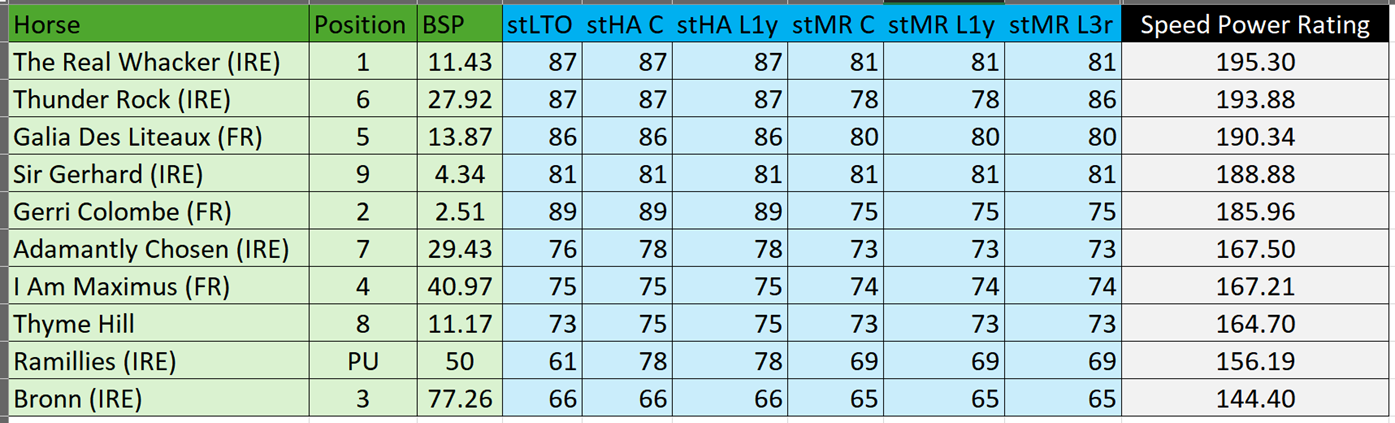
The example I’ve used in the table below is from last year’s Brown Advisory Chase, the Grade 1 championship race over 3 miles for novice chasers at the Cheltenham Festival.
Straight away how well The Real Whacker had shown up in terms of Proform Speed Ratings in both of his previous starts over the larger obstacles are reflected in his SpeedPower Rating. To back up the numbers with some subjective research, he was being described as an ‘exciting prospect”, a “fast and accurate jumper” and a “high-class chaser in the making” after his win in The Dipper Chase on New Years Day.
By contrast Sir Gerhard had suffered an early season setback and didn’t make his chasing debut until Thyestes Day at Gowran Park towards the end of January 2023. His performance there in a 3 runner maiden chase over 2 miles was described as ‘error riddled’. He went straight to Cheltenham after that race, granted with scope for improvement, but also a relatively untested and inexperienced chaser, who was also unproven over the distance.
The power of hype is thankfully alive and well in the racing markets and it ensured the Willie Mullins trained Sir Gerhard went off at a BFSP of just over 3/1. However, our top SpeedPower rated, The Real Whacker from the much lower profile Paddy Neville stable sealed the day instead, at lovely odds of 10/1 on Betfair.
Importing into the Proform Database
Given that we’ve now accomplished the necessary calculations, the next job is to calculate a SpeedPower rating for each runner at the festival since 2013 and import them into the Proform database. Proform allows the user to import up to 4 sets of user ratings.
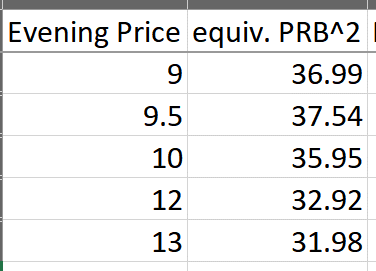
Occasionally the speed ratings will contain a zero. Generally this occurs when a horse has no previous runs in the database, or has never run in today’s race code. Either scenario is a rarity at Cheltenham so I’ve rated any horse with a zero in its rating set as overall zero. If you want to manually enter a PRB^2 in the green section for a runner where there is/are zeros, I would suggest using the mean PRB^2 that is equivalent to the horses evening before price, which is also available in the software. I’ve included that table for reference on the spreadsheet.
The import process is easy and will literally take seconds using the custom built importers that come with the software. I’ve done this already for all races run at the festival between 2013-2023. The import .csv file is available at the *Proform Telegram Members Group which is free for all subscribers.
Establishing Benchmark Pars
So now that we’ve imported all the SpeedPower ratings into the database, it’s time to start analysing our work and see what it throws up in terms of angles for next week.
There are many long standing non-handicap championship races run at the festival every year, where raw ability meets raw ability at level weights (with a nod to age, weight-for-age and sex allowances). Each of these contests attracts horses of similar calibre year after year, so my first thought was to use the SpeedPower ratings - which after all are a measure of a horses raw ability - to establish a median benchmark ‘par’ rating from the winners of these contests between 2013 and 2022. I then wanted to take a look at how runners that both exceeded and were below those benchmark pars performed at the 2023 Cheltenham Festival.
So, let’s start by calculating the benchmark for the Supreme Hurdle using the SpeedPower rating of the winner for each year between 2013 and 2022. This is easily done using the System Builder within the Proform software.
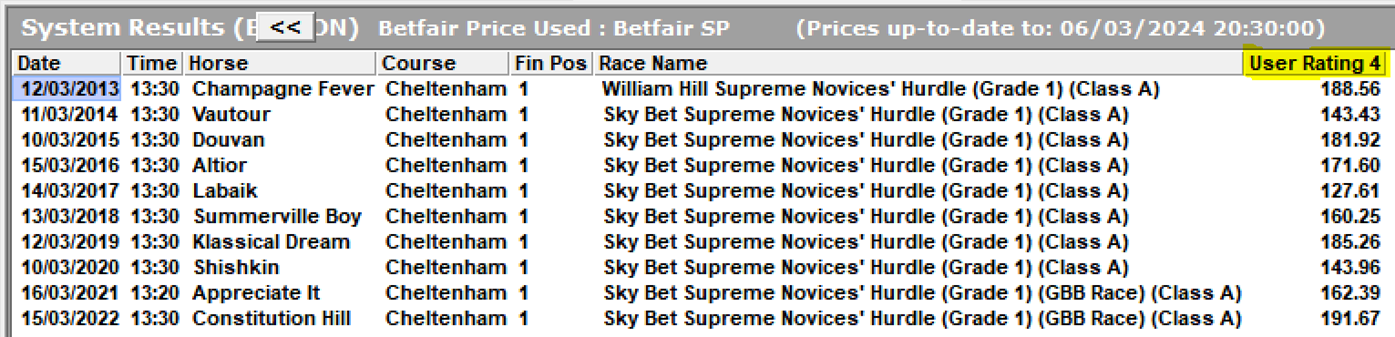
The median SpeedPower rating for the Supreme Hurdle winner over the 10 year period was 166.99, which is rounded down to 166.
I followed a similar process to produce a benchmark par based on the same 10 year period for the following races…
*mares chase par is for its 2 previous editions only
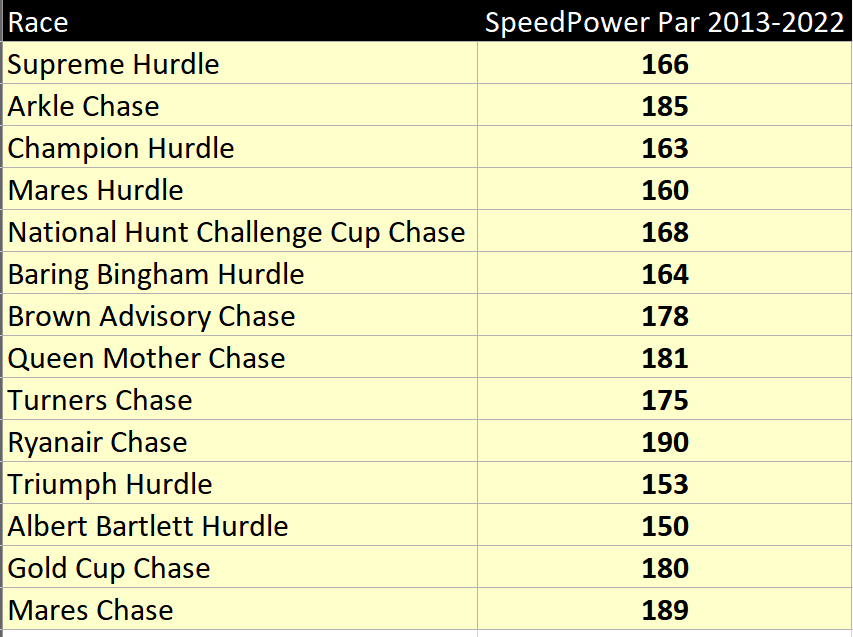
All the runners in the above races at the 2023 Cheltenham Festival were then divided into 3 groups and imported into UserRating 3 in the software as follows…
3 – SpeedPower rating above benchmark par for that race
2 – SpeedPower rating below benchmark par for that race
1 – SpeedPower rating for runner is zero
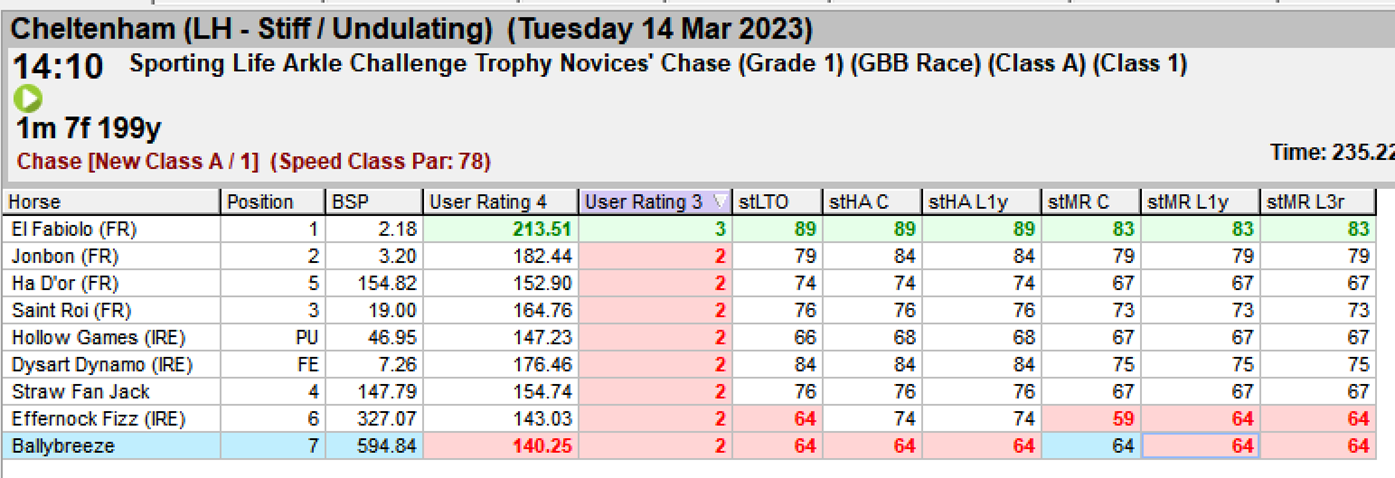
As you can see above in The Arkle, El Fabiolo was the only runner that bettered the previously established benchmark par of 185 and was subsequently coded as a 3 in UserRating 3.
Analysis
The power of the Proform System Builder can then be employed to analyse our work…
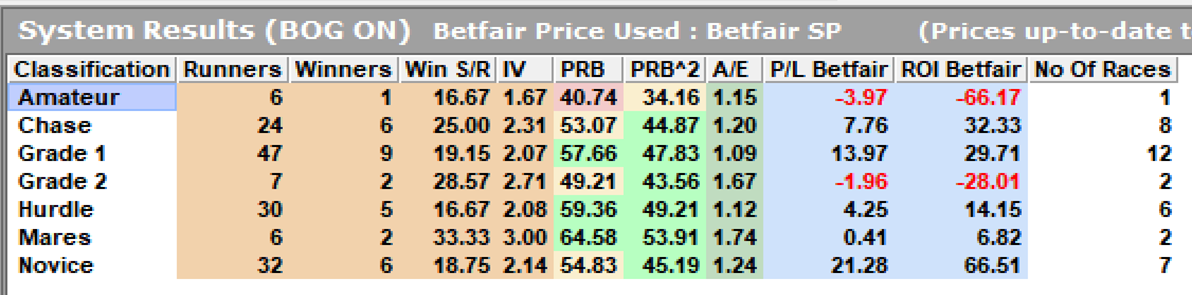
Overall, the results were pretty good. Runners whose SpeedPower rating exceeded the established benchmark par for that race won 11 of the 14 championship races at the 2023 Festival, returned an A/E of 1.16, and a 22% return at BFSP after commission in the win markets.
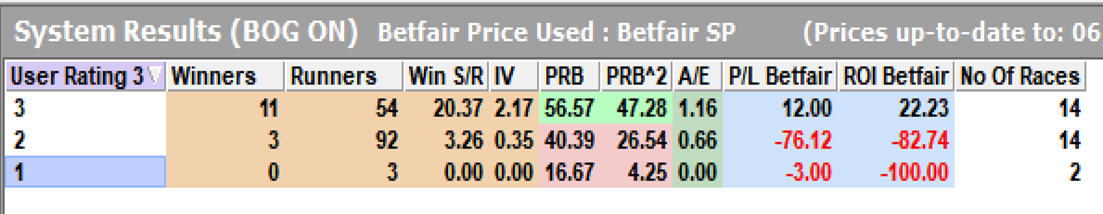
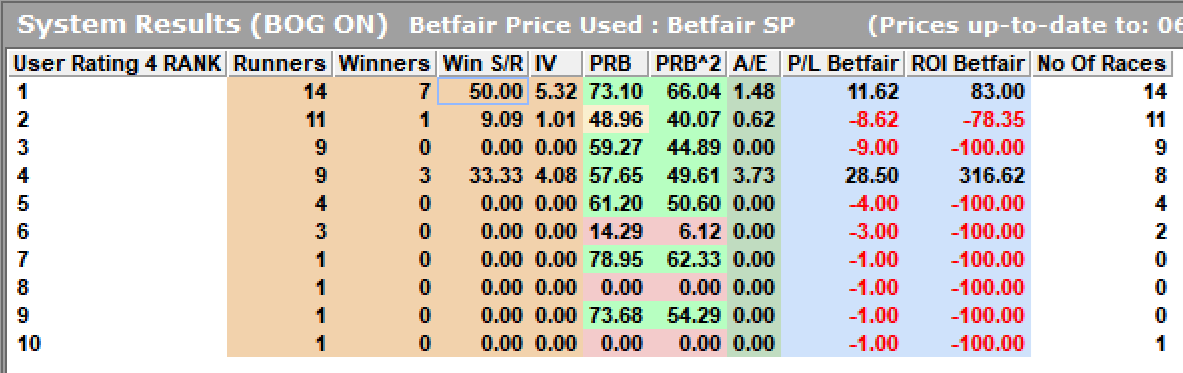
Drilling down a little deeper into these results – Runners that Top Rated on SpeedPower and exceeded the race par, achieved a 50% strike rate.
The Novice races provided particularly rich pickings for runners whose SpeedPower Rating exceeded the race benchmark par. These contests will often enough feature unexposed hype horses without the racecourse figures to back the hype up and can provide angles where shorter priced horses can be taken on. The aforementioned Sir Gerhard is a good example in my opinion.
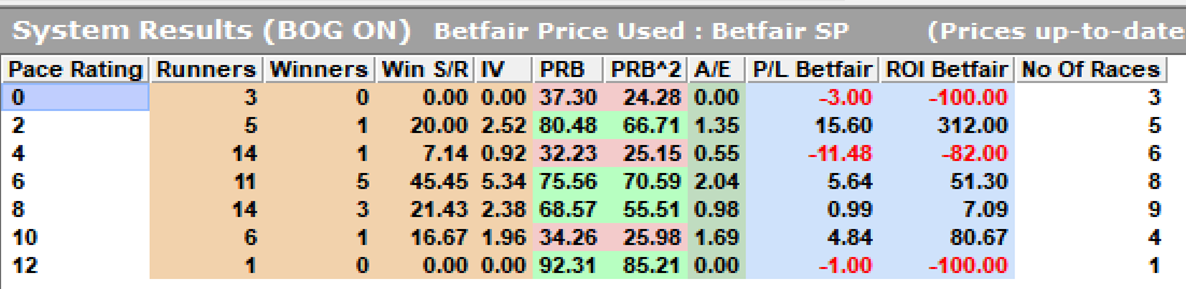
Quality jumps horses racing prominently can often be hard to peg back. Runners with SpeedPower Ratings better than the benchmark par, and a Proform Pace Rating of 6 and above did very well against the market. Stage Star was a good example with a Pace Rating of 10.
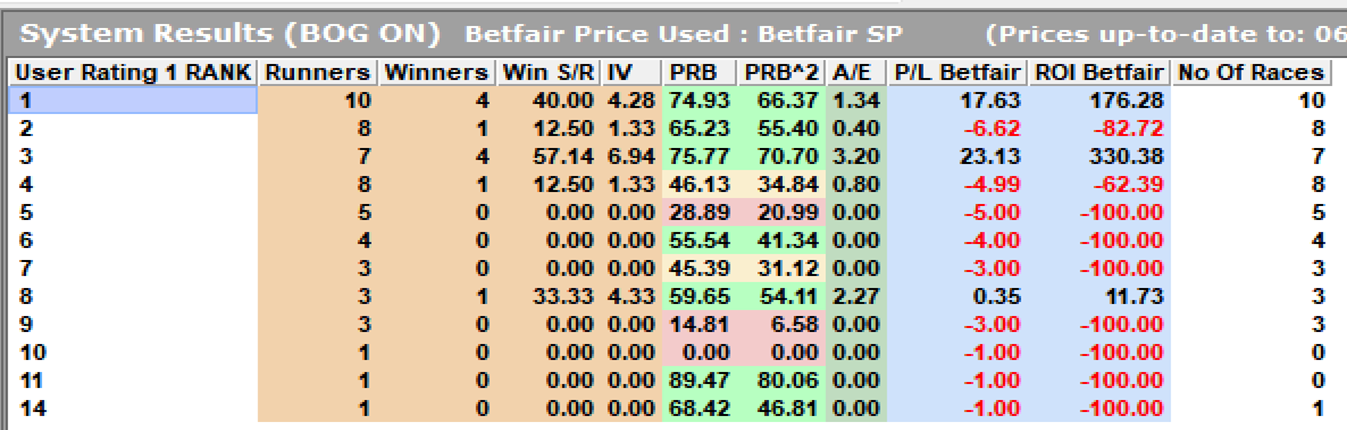
Finally, SpeedPower rated horses whose rating exceeded the established race par did very well when combined with Proform’s signature rating – The Proform Power Rating (User Rating 1).
SpeedPower rated in excess of the race benchmark and also Top Three Rated on the Proform Power Rating did very well. Perhaps too well, so a word of caution is advised here going forward. Combining ratings when you don’t have much evidence to go on can lead to conclusions informed more by luck and variance than anything else. So be careful there.
Conclusion
We have applied a statistical and weighting technique to Proform Speed Ratings to calculate a composite SpeedPower Rating. Those new ratings have been used to calculate Ranked Speed Power Ratings and benchmark pars for 14 of the biggest races at the Cheltenham Festival from data taken between 2013-2022. This process has then been tested using ‘unseen’ data from the 2023 festival. Analysis of the 2023 results has stood up well, with 11 of the 14 championship races being won by horses whose SpeedPower rating exceeded the benchmark established for that race. Producing a BFSP win market profit of 22% in doing so.
So, the conclusion is that Proform Speed Ratings work well!
Of course, it goes without saying (for me anyway) a numbers based approach can be used to provide a framework, context and entry into a race. In my own experience of working with benchmarks on the flat, they are a very valuable weapon in any punter’s armoury for the big non-handicap races where raw ability is the name of the game. However, in a game as nuanced and variant as horse racing is, there are many other factors to consider in any race also. Proform will cover you well there too.
Before Festival Day 1 declarations next Sunday I’ll upload to the *Proform Telegram Members Group the spreadsheet where SpeedPower ratings can be calculated in minutes, and the updated benchmark pars that include the 2023 figures for anyone that may be interested. I’ll also put up the SpeedPower Rating import sheet containing the ratings for all runners at the festival since 2013.
Best of luck next week!
By Paul Fitzgerald
Age 53. Live in County Clare, Ireland.
Followed racing most of my life since watching Red Rum win the 1977 Grand National.
Prefer flat racing.
Been with Proform for more years than I care to remember at this stage, so pretty familiar with the software and its functionality.
Mainly data-based approach to racing. Build my own models, which I combine to calculate a base probability. Adjust that base probability with my own subjective opinion to form a final price, which I then take to the market.
Use Betfair only.
*Proform Telegram Members Group
Proform Subscribers can join the Telegram group chat for which can be used for support, systems
ideas, sharing selections and much more.
If you would like to join, then send me a message on Telegram with your name and your
Proform login email address and we will add you to the group chat.
My telegram username is @proformracing
You can download Telegram on your mobile from here https://telegram.org/
and there is also a desktop version you can install on your computer.
NOTE:
You need to open Telegram on your mobile.
Click on the 3 lines in the top left corner of the screen.
Click on Contacts.
Enter Simon Walton or my telegram name which is @proformracing into the name’s fields and my mobile number 07984 648774.
You should then be able to contact me and give me your full name so we can see that you are a
subscriber and then we can add you to the group
