Making the most of In-running Comments in Proform
January 13th, 2024By Richard Slater
NOTE: You can click on any image to view in a new window and you can download a PDF copy of this article on this link
Introduction
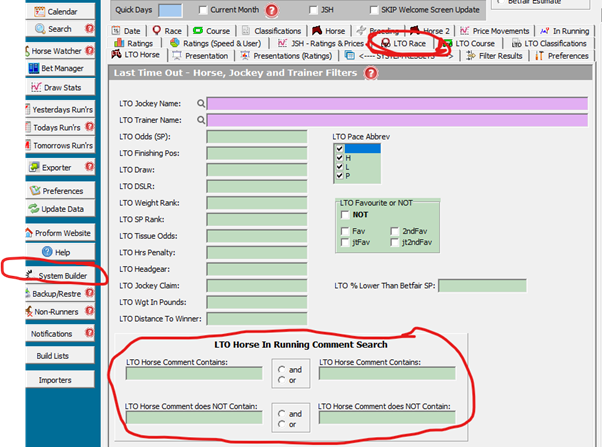
There’s a useful feature in the Proform System Builder that is worth investigating – the LTO Horse In Running Comment Search:
Proform uses the Press Association as a data source so you’re getting their in-running comments and they’re consistent enough to be used as an extra edge. I appreciate that relying on in-running comments - which by their nature are subjective - could appear to be a little dangerous but given the yearly breakdowns in terms of runners and profits are showing reasonably steady numbers it’s worth a good look.
Some of these screenshots have some headings which are clarified in the Proform Glossary document available for download here: https://www.proformracing.com/learn_more.html
- A/W Last Time Out Winners with LTO comment ‘Headway’
I had been flicking through the in-running comments I had exported from Proform and noticed ‘headway’ cropped up often and had a look to see if there were any angles.
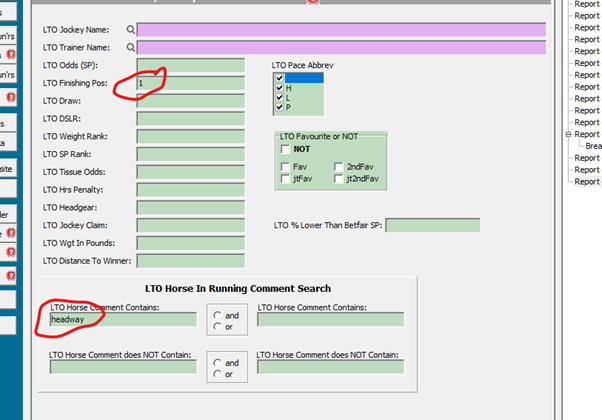
If you input ‘headway’ into the LTO comment box and Finishing Position ‘1’ and select years 2014 to 2023 plus all race types, this time out and last time out you get this:
An impressive sample size but nothing exciting about the returns. But a sample size this big should have a nice ‘seam’ to mine.
Breaking down the results by Race Type this time out gives this:
A/W and Hurdle races look interesting given the Return on Investment at Betfair Starting Price is slightly better than the standard 2% commission factored into these results. I’m not interested in the NHF profit at all. The sample of 842 is already too small to start dissecting. The Actual/Expected Winners of 1.00 indicates there’s an outsider or two creating the profit and there’s a very good chance this profit will not replicate in the future.
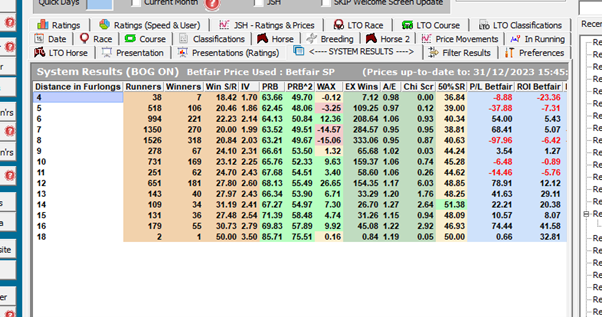
After a bit of trial and error with the Breakdown feature I ended up with this for the A/W:
2, 3, 4 and 5-year-olds in A/W races (all types) broken down by distance of race 2014 to 2023
This makes sense because the ability to make headway in a race is probably more useful at longer distances and it’s the younger horses that are more capable of further improvement and will likely be less exposed.
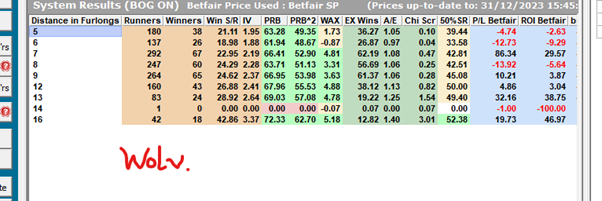
But it’s always worth seeing if the track or the surface is significant:
Wolverhampton looks ok with a 12f+ system cut-off. The 7f return is just a blip helped a lot by a winner at 40.
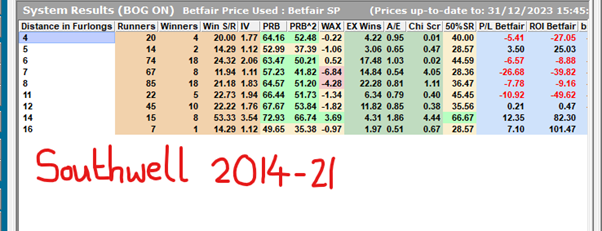
Southwell tapeta 12f+ can be included despite a tiny loss. Early days.
The old Southwell Fibresand surface isn’t responsible for a big chunk of profits at 12f+. Good news.
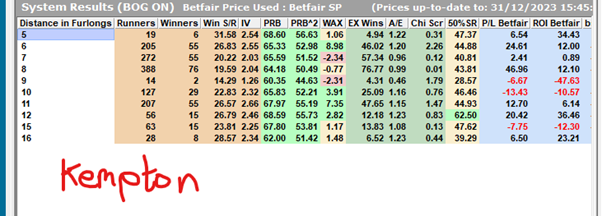
Kempton looks interesting at first glance but an Actual/Expected of only 0.96 and 0.99 for 7f and 8f respectively doesn’t instil much confidence. There’s a winner at 95.0 over 8f so we can stick with 12f+. I wouldn’t make an exception for including 11f at Kempton only unless I had a very good reason.
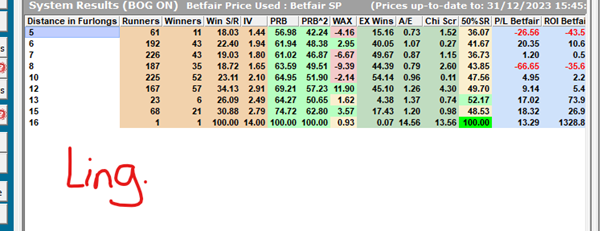
Lingfield looks good for 12f+
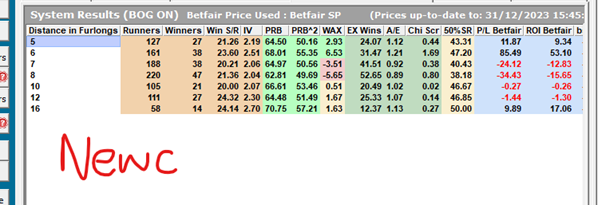
Newcastle don’t really have many races at 12f+ but there’s still a profit there. I would ignore the 5f and 6f profits. You could argue the straight course there could make things work differently but if it did we should expect a better return at 7f and 8f.
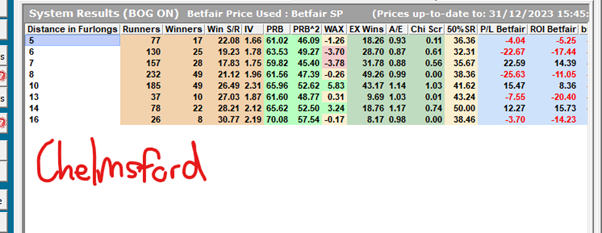
Chelmsford ticks over and makes a small profit at 12f+
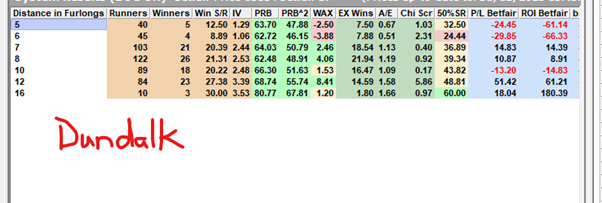
Dundalk looks good. Almost too good with A/E of 1.58 and 1.66 for 12f and 16f. I would expect this to regress to the mean in the future i.e. make less of a profit. I will definitely ignore the profit at 7f and 8f. There will always be ‘blips’ and if you make something course-specific without good reason it’s asking for trouble.
We have ended up with:
3, 4, and 5yos 2014 to 2023 running in A/W races at 12f+ which have the comment ‘headway’ lto:
And broken down by year:
2020 was a weird year (lockdown) and that can probably be ignored.
Note I’ve changed it to 3, 4 and 5yos because there are no 2yo races at 12f+.
We can then run the Reports which will give us a breakdown of all the factors. Way easier than going through each one using the Presentation feature. We’re looking for logical things we can exclude.
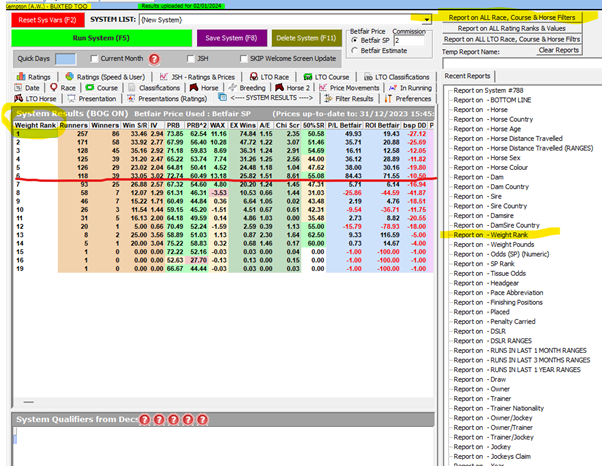
There’s a strong case for sticking with runners ranked in the top 6 in the weights (for this race, not the previous ‘headway’ run). The sample sizes below rank 6 are not big though and the loss could be variance. Remember that weight ranks are determined in the final declaration data so may not always be totally accurate at the time of race due to non-runners and jockey allowances. In reality you are still going to be correct or fairly close a lot of the time though. Your choice if you want to include this or not.
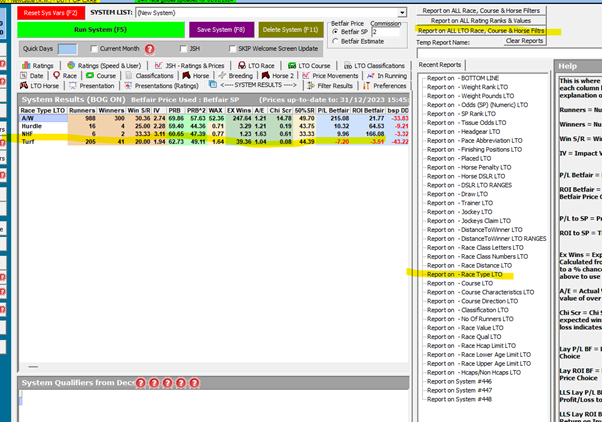
In the Report on all LTO Race, Course and Horse Filters there’s this:
Looks iffy and Turf lto could be excluded on the basis that pace variance in turf races is greater than A/W races so headway lto could be less meaningful.
But if we go back and include only those with weight rank 6 or less we get this:
Going for top 6 in the declared weights has converted Turf races last time out into a profit.
We’ve ended up with a bottom line of:
3, 4 and 5yos 2014 to 2023 running in A/W races at 12f+ (2640 yards+) which have the comment ‘headway’ lto and where they have a weight rank of <7 for the current race:
That’s quite a low drawdown of -31.94 and a decent Actual/Expected Wins ratio of 1.23.
And by year:
Going back to the sample of 925 we can also see a reasonable place return and a fairly low average Betfair starting price which will help prevent those horrible lengthy drawdowns on the betting bank:
- Two and a Half Mile+ Hurdlers with LTO comment ‘Headway’
DATE TAB
2014 to 2023
RACE TAB
Hurdle only
Handicaps only
Number of runners >6
Distance >=4400 yards
Race Class 1 to 4
LTO RACE TAB
LTO Race Types Turf and Hurdle
LTO No. Runners >6
Handicaps only
HORSE TAB
Age >4
LTO HORSE TAB
LTO Finishing Position 1
LTO Horse Comment contains Headway
A decent return from a reasonable sample. There’s a winner at 146.94 but it’s not relying on one or two high odds winners to make a profit. A nice Betfair Place SP profit of 171.87 in there with 52 placed more than expected. Average odds of 12.13 means the highest drawdown was 45.49 so not too bad there either.
There’s another element that can’t be entered into the system if you want the software to flag qualifiers in advance – the Betfair starting price. This is obviously not known until the start of the race so must be left out.
It seems this system is best with a BFSP of >=4.5. If you enter <3.5 in the Horse tab Odds (BSP) field below you get the results underneath. It is Numeric rather than Decimal so it is Betfair price minus 1.
If we enter >=3.5 in the Odds (BSP) field in the Horse tab we get the results from ignoring Betfair Starting Prices of less than 4.5:
We’ve cut out a chunk of low odds horses (332) that don’t generate a profit.
And by year:
The place returns and Win Odds analysis (2014 at top, 2023 at bottom):
A decent Betfair Place strike rate, profit every year except 2021 for place bets, Average Odds and Win Odds will be acceptable for most and it’s not relying on outrageous winners every year to crank out a profit.
To show the effect of the comment ‘Headway’ here’s the system set up with LTO comment NOT ‘Headway’ with bfsp >=4.5 added (>=3.5 in the Numerical field):
We’ve gone from a profit of +639.94 to a loss of -181.86. That’s a massive swing for one word. There’s also a loss of -105.33 for Betfair Place SP bets.
Have a go at some other variables. There’s a good chance you will be able to improve on what I have found so far.
- Comments ‘Switched’ and ‘Strongly’
The following are just a few ideas that might get you started:
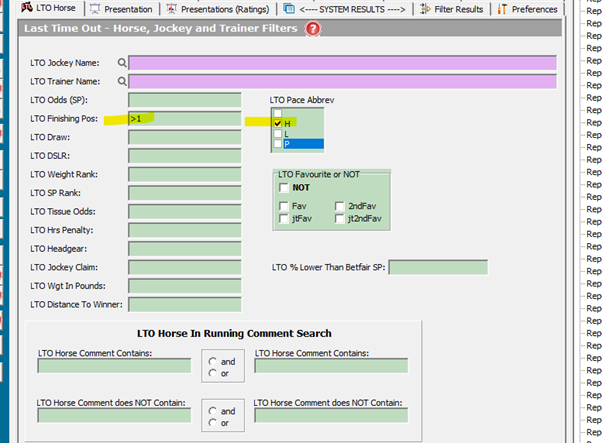
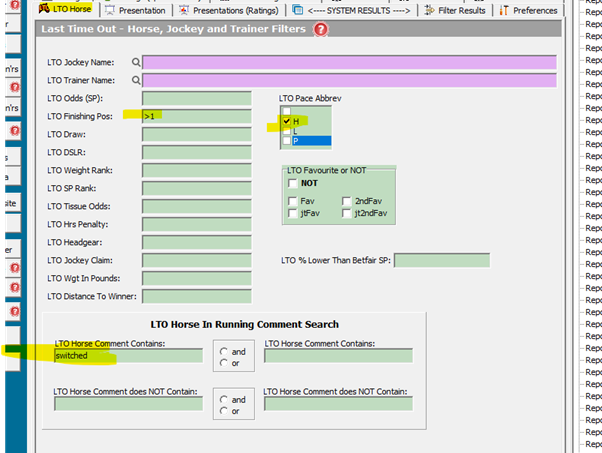
Here’s the results for all A/W races 2014 to 2023 where the horse was held up and did not win last time out. All Races and Race Types last time out.
Looks not so good with Winners against Expected of -115.71 and an ROI of -7.30% on Betfair (including 2% commission)
Now let’s add in ‘Switched’ in horse last run:
Actual/Expected has dropped to 0.92 and ROI now down to -11.27%. This wouldn’t be interesting at all with a much smaller sample but this is impossible to ignore with a sample of 7493. The Chi score has shot up to 7.07 from 1.32 in the sample without the comment which indicates this is highly unlikely to be down to just variance.
Quite why ‘Switched’ is a negative I can only guess at. We are looking at Hold-up runners that did not win LTO. If there was a pace collapse LTO they still couldn’t capitalise because they didn’t win. Maybe they don’t start particularly well and use up too much energy earlier then need to be switched because there’s traffic issues due to them not being able to keep up with the pace early. Andrew Mount has suggested one reason could be that it is horses that perform better in small fields that find trouble in running that requires them to be switched. It looks like there is something in that. Here’s the breakdown by field size in the race after the ‘switched’ race:
It looks like fields of 7 runners or less are better for horses that were switched last time out.
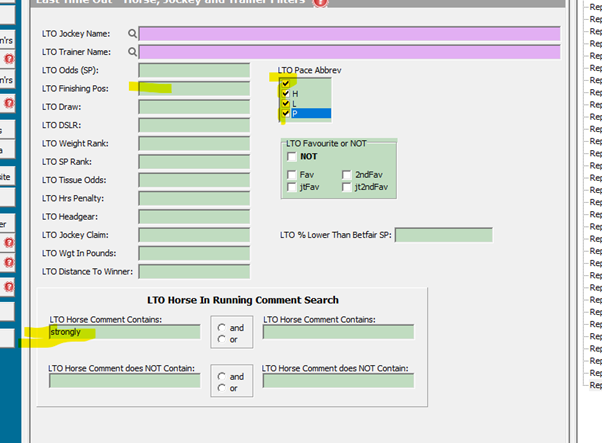
If you substitute ‘Switched; for ‘Strongly’ you get the opposite effect:
And if you then take out LTO Finishing Pos >1 and include all Pace Abbreviations from LTO like this:
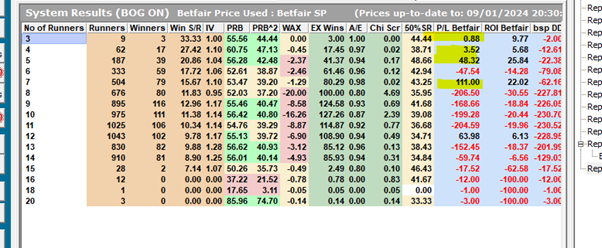
You should end up with this:
An Actual/Expected ratio of 1.06 is reasonable but not fantastic. But it’s an interesting angle. And a Win Strike Rate of 20.37% helps ensure Drawdown is kept at a manageable -83. There might be more to this if you experiment with the Presentation and Report options. However, the sample size of 3510 may not offer enough room to filter further and leave a profitable sample that is meaningful enough to replicate in the future.
One option is to combine comments to get more meaningful samples. I’ve just input the filters below because I’m trying to get an idea of whether Hold-up horses that give a more ‘honest’ but unimpressive effort are actually worse betting propositions than others, particularly if they are not fancied by the market.
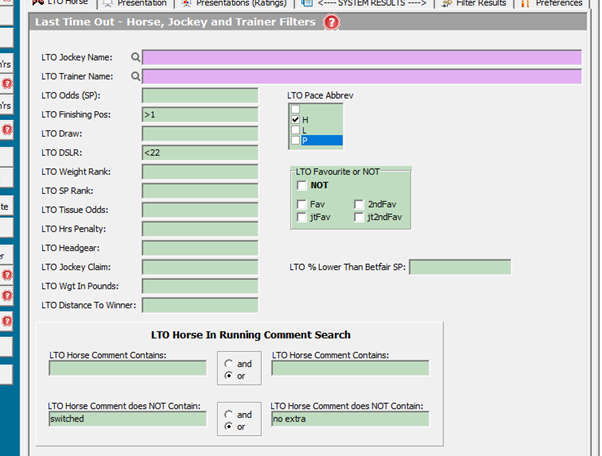
I tried 2014-2023 A/W Races this race, Held Up LTO, Finishing Position LTO >1, ran again within 21 days (less likely to improve in a short period?), and which did NOT earn the comment ‘Switched’ or ‘No Extra’. This is all Races and Race Types LTO.
I added Betting Rank >4 in the Horse tab to get the less-fancied runners.
The end results are:
Fairly predictable. We already know Hold-up LTO horses aren’t as good propositions as those that ran Prominently or Led LTO.
If I keep everything as it is except move the 2 comments in the LTO Horse tab like this:
The results are:
It’s a big loss of -35.22% ROI for Betfair Starting Price, a terrible A/E and a decent Chi score. The comment ‘No extra’ actually produces slightly worse results than ‘Switched’
I have no idea yet if the <22 days cut-off produces the worst results. Or even if the comments ‘switched’ and ‘no extra’ should really be grouped together. I put this together as an experiment late on and decided I should definitely include it in this article. I’ll be digging into this more in the next few weeks. I’ll be looking to get as big a sample of ‘extreme negative’ horses as possible.
Conclusion
There’s a lot to look at. I suggest adding in these comments - and combinations of them - to your existing A/W systems and seeing what happens. Then have a go at some more comments. I’ll find a way of working out the most common words in the comments and post them in the forum with their frequency.
Remember there’s some comments that might not fit what you want to look at – for example you’ll occasionally see a comment ‘started strongly’. Not many of these but it explains why there’s a small sample of horses either not finishing or finishing way down the field that appear when looking at ‘Strongly’.
Hopefully this has got you thinking. It might improve some of your systems. I haven’t got the time to watch replays for hours and have already added some comments into my own models. Even if you do not use Proform systems or build your own models and you prefer the more ‘old school’ form study it’s still worth investigating angles such as these and noting down large sample positives and negatives so you can narrow the fields down more easily.
By Richard Slater
Very interested in finding angles in horse racing since late 90s. I live in Yorkshire with my remarkably tolerant wife and 11 year-old twins. I’ve worked mainly in the sports betting industry since 2004, although unfortunately I don’t deal with horse racing at the moment. Still developing logistic regression models which are designed to spot wrongly priced horses and future market moves and I’ll be working hard on finding even better ways of modelling this in 2024.


