
Course Profiles Explanatory Notes
The course map has been obtained from Google Earth images and the outline we have added to improve clarity were drawn from tools on that site. The line sticking out is the winning post. Similarly, all figures in the grid have been obtained from Google Earth.
The figures in yellow on the map on the left are the difference in the elevation at that point to the lowest point on the course measured in feet. As with all satellite imagery it is subject to a small margin of error. While this margin of error is compounded by the fact that the historic imagery shows the position of the running rails can vary from year to year, it remains accurate enough to allow the comparison of courses.
The map on the right shows the starting positions for races at that course. These have been determined using measuring tools in Google Earth and reference to race recordings. In some cases, they are noticeably different to those shown on racecourse maps in the racing press.
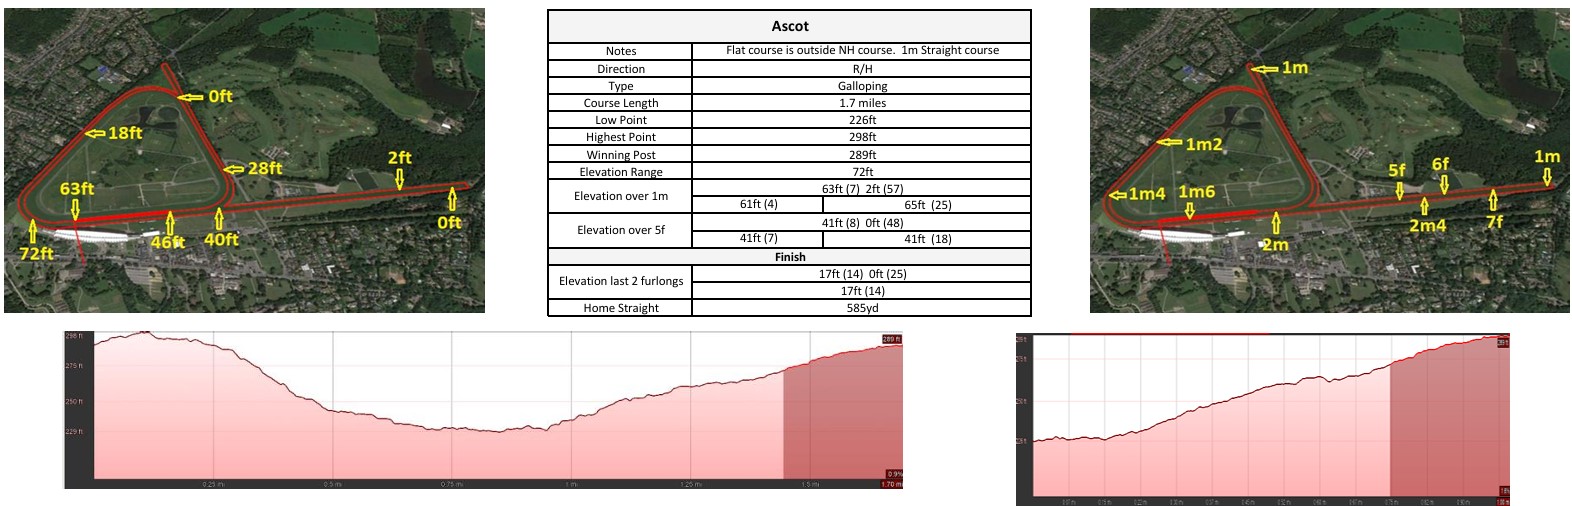
In the grid all heights in feet are the level above sea level. Elevation Range is simply the difference between the highest and lowest points.
The top figures for Elevation over 1m and 5f are a sum of the ascents (1st figure) and descents in a theoretical race over that distance followed by its rank when compared to other courses. A rank of 1 indicates the course has the most severe ascents or descents.
The 1st figure on the second line shows the height difference between the finishing line and the starting position. A minus figure indicates the finish is below the start.
The 2nd figure is the sum of the ascents and descents. The 1m figures are for the normal course while 5f uses the straight course if there is one. Using these theoretical race distances allows a direct comparison between courses.
The course type describes the courses general character. Courses were sorted into each category by applying the following rules in order.
