

Fence Difficulty in GB and Irish Chases
April 1st, 2024By Richard Slater
NOTE: You can click on any image to view in a new window and you can download a PDF copy of this article on this link
Introduction
One aspect of chase races that seems to be largely ignored is fence difficulty. I realised I hadn’t seen much research on this so I decided it was worth investigating for my second article.
I settled on horses that Fell or Unseated Rider to measure difficulty. Adding Unseated Rider bumped up the sample size quite a bit and seemed logical because although it can be caused by a slip or jink it’s usually the fence that causes the problem. There are various issues that mean this is by no means a perfect way of measuring fence difficulty. Some tracks have a greater proportion of races run over longer distances and therefore more fences to jump and some tracks that have more races for inexperienced horses. Some tracks have repositioned fences for safety reasons – for example Cheltenham Old Course 2nd last fence has been moved 3 times in the last 10 years.
I set up the Exporter to export the 7 fields below for all chases in GB and Ireland from January 1st 2013 to December 31st 2023:
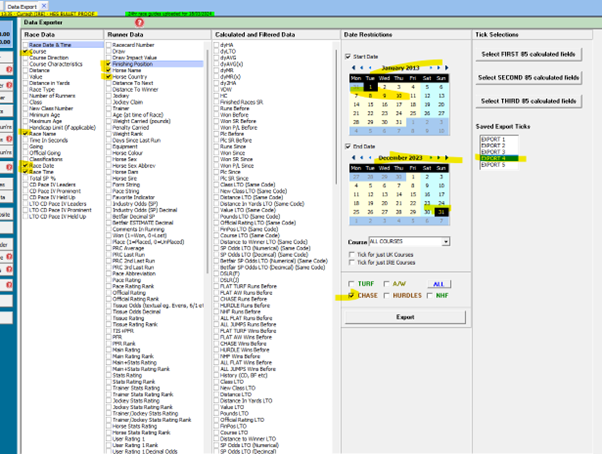
A useful recent feature of the Exporter are the saved Export ticks in the right where if you have different fields required for different exports it will remember which ones you selected for future exports.
The Race name field was included so I could differentiate between Aintree Mildmay and Aintree National.
The Horse Country field was included in case I decided to do some work which required looking back at previous runs. This would enable me to create a unique horse reference in case some horses shared the same name.
This gave me a file with 160693 runs in this format:
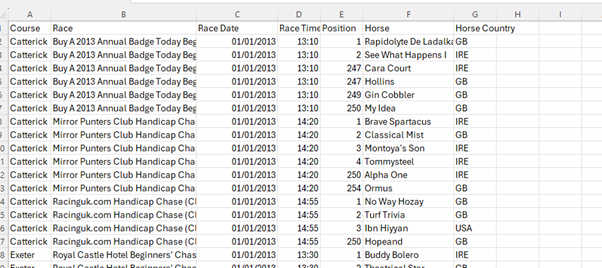
Position 247 indicates Unseated Rider and Position 250 indicates Fell.
The 5 races run over Grand National fences are:
Fox Hunters' Chase
Topham chase
Grand National Chase
Becher Handicap Chase
Grand Sefton
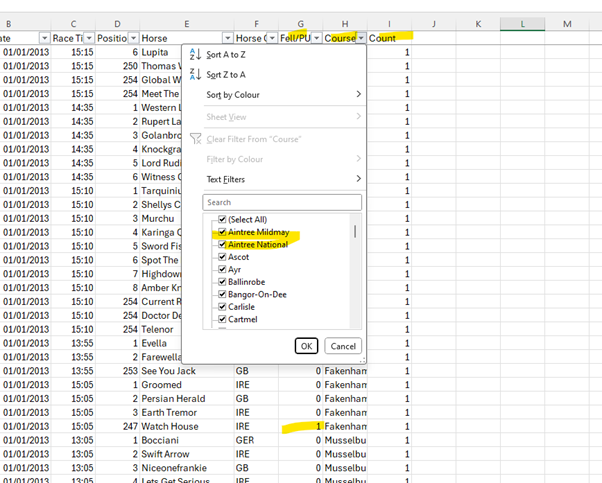
A bit of work in Excel ends up with a new Course column with Aintree Mildmay and National, a Fell/UR flag and a Count column for Pivot tables
A pivot table then gives the breakdown of Fell/UR runners by year in the format below.
A full breakdown for every track is available at the end of this article in Appendix 2
Example:
Runs Fell/UR % Fell/UR
|
Ayr |
2391 |
203 |
8.49 |
|
2013 |
192 |
20 |
10.42 |
|
2014 |
204 |
15 |
7.35 |
|
2015 |
225 |
33 |
14.67 |
|
2016 |
251 |
27 |
10.76 |
|
2017 |
248 |
16 |
6.45 |
|
2018 |
257 |
18 |
7.00 |
|
2019 |
232 |
20 |
8.62 |
|
2020 |
141 |
10 |
7.09 |
|
2021 |
200 |
15 |
7.50 |
|
2022 |
233 |
15 |
6.44 |
|
2023 |
208 |
14 |
6.73 |
Ayr is similar to quite a few tracks where the % of Fell/UR runners has reduced in recent years.
Other examples are Down Royal and Fakenham:
Runs Fell/UR % Fell/UR
|
Down Royal |
1724 |
139 |
8.06 |
|
2013 |
181 |
22 |
12.15 |
|
2014 |
159 |
17 |
10.69 |
|
2015 |
179 |
32 |
17.88 |
|
2016 |
163 |
14 |
8.59 |
|
2017 |
180 |
16 |
8.89 |
|
2018 |
145 |
7 |
4.83 |
|
2019 |
142 |
9 |
6.34 |
|
2020 |
129 |
1 |
0.78 |
|
2021 |
152 |
9 |
5.92 |
|
2022 |
147 |
8 |
5.44 |
|
2023 |
147 |
4 |
2.72 |
|
Fakenham |
1779 |
224 |
12.59 |
|
2013 |
143 |
29 |
20.28 |
|
2014 |
162 |
35 |
21.60 |
|
2015 |
172 |
24 |
13.95 |
|
2016 |
182 |
30 |
16.48 |
|
2017 |
167 |
19 |
11.38 |
|
2018 |
159 |
18 |
11.32 |
|
2019 |
148 |
16 |
10.81 |
|
2020 |
135 |
11 |
8.15 |
|
2021 |
203 |
14 |
6.90 |
|
2022 |
158 |
14 |
8.86 |
|
2023 |
150 |
14 |
9.33 |
A good look at the list at the end of the article shows quite a bit of variation.
I needed a way of defining the fence difficulty at each track. One option was to do a rolling average but that would have given varying figures for each year by track. That would not have been ideal because it would have made the cut-off on January 1st each year when it should really be the start of each season.
After trying a few things, I just settled on taking the average for 2017 on. The purpose of this research was not to investigate each track individually but to find wider trends based on fence difficulty across a range of tracks.
% of Fell/UR in Chase Races by Track since 2017
|
% Fell/UR |
||
|
Aintree National |
21.13 |
|
|
Leopardstown |
IRE |
12.91 |
|
Punchestown |
IRE |
11.07 |
|
Listowel |
IRE |
10.70 |
|
Sligo |
IRE |
10.69 |
|
Thurles |
IRE |
10.23 |
|
Naas |
IRE |
9.78 |
|
Killarney |
IRE |
9.56 |
|
Fakenham |
9.46 |
|
|
Plumpton |
9.35 |
|
|
Ludlow |
9.10 |
|
|
Newcastle |
8.58 |
|
|
Haydock |
8.52 |
|
|
Fairyhouse |
IRE |
8.52 |
|
Limerick |
IRE |
8.40 |
|
Catterick |
8.35 |
|
|
Galway |
IRE |
8.31 |
|
Tipperary |
IRE |
8.16 |
|
Wetherby |
7.90 |
|
|
Tramore |
IRE |
7.86 |
|
Gowran Park |
IRE |
7.40 |
|
Cheltenham |
7.31 |
|
|
Clonmel |
IRE |
7.23 |
|
Cork |
IRE |
7.21 |
|
Taunton |
7.18 |
|
|
Ayr |
7.11 |
|
|
Wincanton |
6.95 |
|
|
Navan |
IRE |
6.92 |
|
Wexford |
IRE |
6.66 |
|
Towcester |
6.58 |
|
|
Ascot |
6.55 |
|
|
Chepstow |
6.37 |
|
|
Downpatrick |
IRE |
6.31 |
|
Perth |
6.31 |
|
|
Kempton |
6.28 |
|
|
Sandown |
6.22 |
|
|
Hereford |
6.12 |
|
|
Newbury |
6.05 |
|
|
Musselburgh |
5.96 |
|
|
Kelso |
5.94 |
|
|
Ffos Las |
5.88 |
|
|
Lingfield |
5.86 |
|
|
Hexham |
5.86 |
|
|
Roscommon |
IRE |
5.69 |
|
Doncaster |
5.53 |
|
|
Market Rasen |
5.48 |
|
|
Exeter |
5.42 |
|
|
Kilbeggan |
IRE |
5.39 |
|
Southwell |
5.35 |
|
|
Bangor-On-Dee |
5.31 |
|
|
Stratford |
5.29 |
|
|
Sedgefield |
5.21 |
|
|
Down Royal |
IRE |
5.18 |
|
Leicester |
5.05 |
|
|
Huntingdon |
5.01 |
|
|
Ballinrobe |
IRE |
4.94 |
|
Newton Abbot |
4.68 |
|
|
Aintree Mildmay |
4.58 |
|
|
Uttoxeter |
4.53 |
|
|
Carlisle |
4.24 |
|
|
Fontwell |
3.96 |
|
|
Worcester |
3.87 |
|
|
Warwick |
3.81 |
|
|
Cartmel |
3.40 |
As expected the Irish tracks dominate the top of the list which may well explain why the % of Irish-trained winners has been going up for quite a while. The % number of Fell/UR at Irish tracks has declined since 2013 but not at the same rate as GB tracks. See the graph at the end of this article (Appendix 1).
Instead of repeatedly selecting groups of tracks in System Builder we can import the track difficulty % since January 1st 2017 as one of the ratings values:
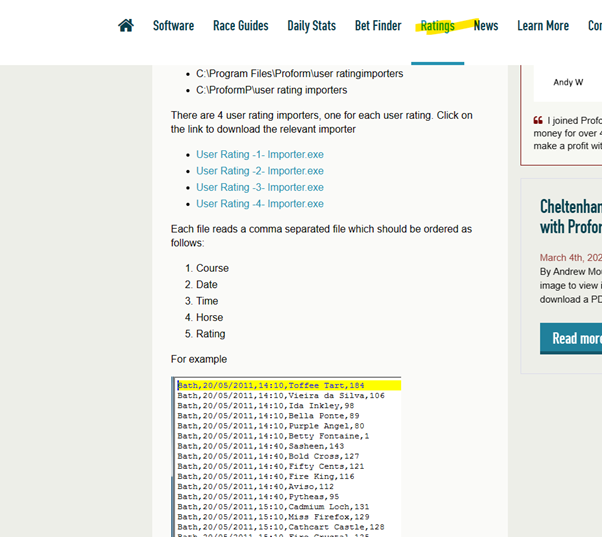
I assembled a file containing Course, Date, Time, Horse, Rating like the one below:
|
Cheltenham |
01/01/2017 |
12:50 |
Tour Des Champs |
7.31 |
|
Cheltenham |
01/01/2017 |
12:50 |
Doctor Harper |
7.31 |
|
Cheltenham |
01/01/2017 |
12:50 |
Arpege D'alene |
7.31 |
|
Cheltenham |
01/01/2017 |
12:50 |
Sizing Codelco |
7.31 |
|
Cheltenham |
01/01/2017 |
12:50 |
Warrantor |
7.31 |
|
Cheltenham |
01/01/2017 |
12:50 |
Racing Pulse |
7.31 |
|
Cheltenham |
01/01/2017 |
12:50 |
Chase The Spud |
7.31 |
|
Cheltenham |
01/01/2017 |
12:50 |
Aubusson |
7.31 |
|
Cheltenham |
01/01/2017 |
12:50 |
A Good Skin |
7.31 |
|
Cheltenham |
01/01/2017 |
12:50 |
Belmount |
7.31 |
|
Cheltenham |
01/01/2017 |
12:50 |
Any Currency |
7.31 |
|
Cheltenham |
01/01/2017 |
12:50 |
Capard King |
7.31 |
|
Cheltenham |
01/01/2017 |
12:50 |
Kingswell Theatre |
7.31 |
|
Cheltenham |
01/01/2017 |
12:50 |
Lamb Or Cod |
7.31 |
|
Cheltenham |
01/01/2017 |
12:50 |
Samingarry |
7.31 |
|
Cheltenham |
01/01/2017 |
12:50 |
Vyta Du Roc |
7.31 |
|
Musselburgh |
01/01/2017 |
13:05 |
Rolling Thunder |
5.96 |
|
Musselburgh |
01/01/2017 |
13:05 |
St Johns Point |
5.96 |
|
Musselburgh |
01/01/2017 |
13:05 |
Mister Don |
5.96 |
|
Musselburgh |
01/01/2017 |
13:05 |
Apachee Prince |
5.96 |
|
Musselburgh |
01/01/2017 |
13:05 |
Misfits |
5.96 |
|
Musselburgh |
01/01/2017 |
13:05 |
Toreador |
5.96 |
|
Musselburgh |
01/01/2017 |
13:05 |
Valentino's Choice |
5.96 |
The track % Fell/UR was then imported into the User Rating 4 field using a csv file as per the instructions. This field can accommodate decimal places, unlike User Rating 1, 2 and 3 fields. If you already have a rating in UR4 you can simply multiply these figures by 100 and import into UR1, 2 or 3 and just remember that if you want to look at tracks with for example a % Faller/UR rate of less than 6% you must enter <600.
Once imported this meant every horse with a chase run since January 1st 2017 to 31st December 2023 had a rating for each run representing the track difficulty which can now be analysed in System Builder.
Proform Members can access this file from the members only Telegram group.
You can import this and do your own analysis. If you wish to change the ratings remember Aintree Mildmay and National Course races must be identified by the current values because the track name is the same.
How fence difficulty can affect profitability:
I didn’t spend time finding ideal cut-off points to prove/disprove anything. The 6.0% Fell/UR cut-off was simply chosen because it’s almost half-way down the list of GB tracks in terms of difficulty. Class 1 and 2 races were excluded because top class horses/races often don’t conform to the same patterns as lower class races.
I set up System Builder like this:
Course tab: Only UK courses selected
LTO Horse tab: LTO Pace Abbrev only ‘H’ ticked, LTO Placed Yes/No ‘1’ entered.
Date tab: ‘2018 to 2023’ ticked.
Horse tab: in DSLR (days since last run) ‘<366’ entered, SP (Starting Price) Rank ‘<4’ entered.
LTO Race tab: LTO Race Types only ‘Chase’ ticked.
Race tab: In ‘Race Types’ only ‘Chase’ ticked, in ‘Race Classes’ only ‘3,4,5,6,7’ ticked, in ‘Distance’ I entered ‘<4800’ and ‘Number of Runners’ I entered ‘>3’.
Note I chose 2018 on instead of 2017 on because if I wanted to look at a horse’s previous run within the past year I would still be using percentages from the overall sample being used. If I looked at early 2017 then I would probably be looking at runs from 2016 and 2016 data is not part of the figures.
Then in Presentation Ratings tab I ticked ‘by User Rating 4 value’ to be able to see the results in track difficulty order.
So we have class 3 and below races where the horse ran in a chase last run in the previous 365 days, is in the top 3 in the betting, placed lto after being held up and is running in a race of more than 3 runners that is shorter than 2m 6f.
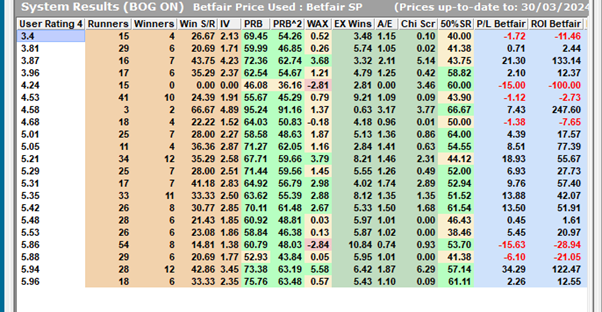
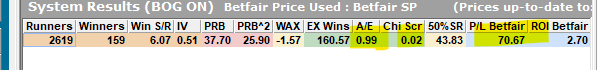
If in the Ratings (Speed and User) tab I enter ‘<6.0’ in the User Ratings by Value/User Rating 4 field I get the results for those tracks with a Fell/PUp rate of less than 6.0%. To find out which track is indicated you’ll have to match the User rating 4 with the % of Fell/UR runners in the table listed earlier.
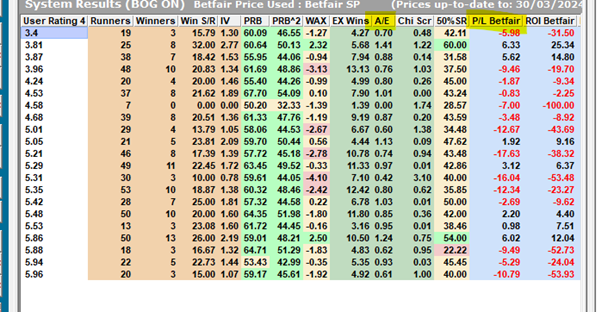
Actual/Expected wins generally below 1.0 and Betfair starting price P+L generally in minus.
and the bottom line is this:
We are looking at a sample where the average BFSP is 4.99 so a loss of 89.36 is starting to look significant.
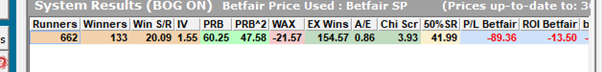
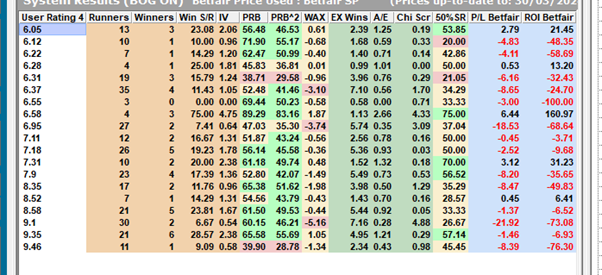
Now let’s look at the tracks with a ‘difficulty’ of more than 6.0% (I enter ‘>6.0’ in the User Ratings by Value/User Rating 4 field):
The bottom line is this:
Nothing too exciting but when compared to the previous example it’s looking like the market might not be taking into account fence difficulty with races of 2m 6f or less where hold-up horses with a fair run LTO are concerned.
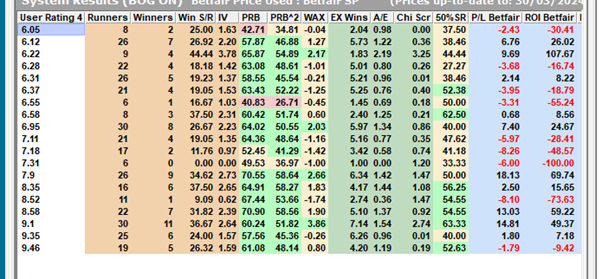
Now let’s flip it round and look at longer distance races:
So we have class 3 and below races where the horse ran in a chase last run in the previous 365 days, is in the top 3 in the betting, placed lto after being held up and is running in a race of more than 3 runners that is 2m 6f or further. We’re only changing the distance to >4800 yards in the Race tab.
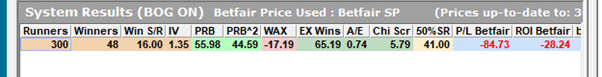
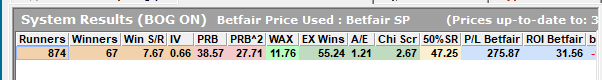
Tracks with a ‘difficulty’ of less than 6.0% (‘>6.0’ in the User Ratings by Value/User Rating 4 field):
With a bottom line of:

Average bfsp of 5.28 so this is looking good. Actual/Expected wins 1.22. Chi score of 7.16 very encouraging.
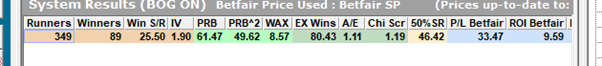
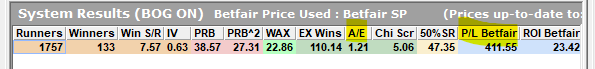
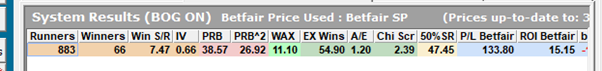
And for tracks with a ‘difficulty’ of greater than 6.0% (Ratings (Speed and User) tab ‘>6.0’):
With a bottom line of:
A hold-up runner in the first 3 in the betting having placed lto seems to have more chance of being a value bet at longer distances on a track with easy fences or at shorter distances on a track with more difficult fences. This could well be because front/prominent runners need a test in order to be disadvantaged. The easier the fences the further they need to run to be inconvenienced?
If horses held up last time out at longer distances at tracks with more difficult fences aren’t generally value bets then where exactly does the value tend to lie? I had a look at prominent/front runners lto and that didn’t really give me anything totally convincing but feel free to load in the file and have a look for yourselves.
I used the settings below to find that with difficult fences and longer distances the value seems to generally lie with hold-up horses lto that did NOT place and are not in the first 3 in the betting:
Course tab: Only UK courses selected
LTO Horse tab: LTO Pace Abbrev only ‘H’ ticked, LTO Placed Yes/No ‘0’ entered.
Date tab: ‘2018 to 2023’ ticked.
Horse tab: in DSLR (days since last run) ‘<366’ entered, SP (Starting Price) Rank ‘>3’ entered.
LTO Race tab: LTO Race Types only ‘Chase’ ticked.
Race tab: In ‘Race Types’ only ‘Chase’ ticked, in ‘Race Classes’ only ‘3,4,5,6,7’ ticked, in ‘Distance’ I entered ‘>4800’ and ‘Number of Runners’ ‘>3’.
Ratings (Speed and User) tab/User Rating 4 value ‘>6.0’
The bottom line is this:
Not too shabby. The Betfair P+L is inflated by a winner at 200.0 but the A/E and the Chi score are interesting.
And the same setting above except for Ratings (Speed and User) tab/User Rating 4 value ‘<6.0’ (less difficult fences):
A totally unremarkable return suggesting fence difficulty is affecting market efficiency.
If we go back to the more difficult fences and look at the fence difficulty for the horses’ previous run we are now looking back at ratings for January 1st 2017 onwards:
Back to Ratings (Speed and User) tab/User Rating 4 value ‘>6.0’
Plus:
Then for difficult fences lto of >6.0:
And for less difficult fences lto (<6.0):
Doesn’t seem to matter – almost identical A/E. And distance of previous race doesn’t seem to matter too much either if you look at <4800 yards and >4800 yards in the LTO Race tab.
This seems to suggest longer distance races with more difficult fences make it harder for horses with better form LTO to perform to market expectations and we have more outsiders winning. Logically we will be seeing more mistakes because of the number of difficult fences. Even if the extra fences are jumped cleanly the extra energy used in clearing them compared to easy fences must make a difference.
All this is just a start. I’m going to have a good dig around in my own database and see what extra I can find. There’ll be other angles to be found, particularly with those long distance races over difficult fences. It’ll not all be about run style lto. Try selecting only novice handicap chases and see what happens with runners that haven’t really done much yet – not top 2 in the weights or not in the top 3 in the betting for example. Then have a look at the difference between easier fences and harder fences. You will find that outsiders win a lot more at easier tracks. Is the main reason for this because they don’t have to run better than expected AND worry about jumping tricky fences? I haven’t had a good look at Ireland yet but early research shows it doesn’t behave the same as GB tracks but that’s often the case.
I would caution against building a system based on fence difficulty involving a range of tracks and then eliminating the tracks in that range that make a loss (or a profit if building a lay system) unless you have a very good reason to do so. When any sample is broken down you will get elements that don’t appear to be desirable but this is often simply variance. If the underlying principle is sound the worse performing tracks should improve and the best performing tracks would decline as things regress to the mean.
By Richard Slater
Very interested in finding angles in horse racing since the late 90s. I live in Yorkshire with my remarkably tolerant wife and 11 year-old twins. I’ve worked mainly in the sports betting industry since 2004, although unfortunately I don’t deal with horse racing at the moment. Still developing logistic regression models which are designed to spot wrongly-priced horses and future market moves and I’ll be working hard on finding even better ways of modelling this in 2024.
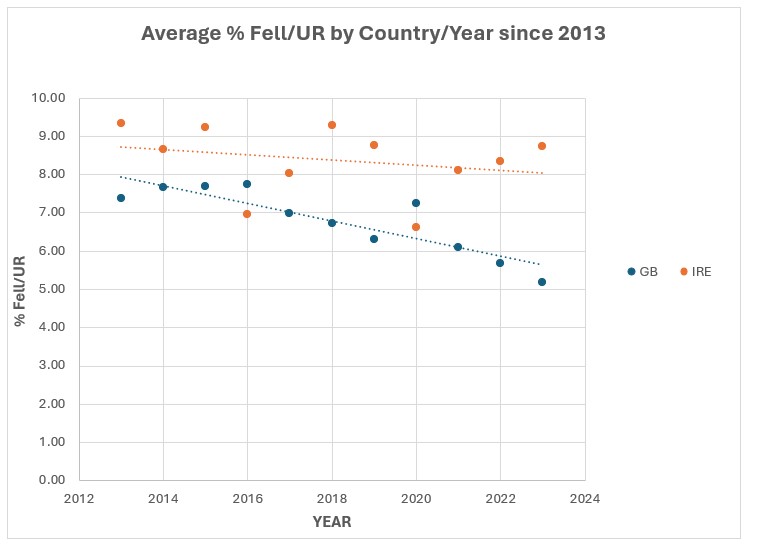
Appendix 1
Summary of % of Fell/UR at all Irish tracks compared with GB tracks since 2013:
The graph below clearly shows that GB tracks have reduced in difficulty a lot more since 2013 compared to Irish tracks. Does this explain the dominance of Irish horses at Cheltenham?
Appendix 2
Fell/Unseated Rider by Track and Year since 2013:
You can view these in PDF copy of this article on this link
