

Market Efficiency and Tote Ratios
March 1st, 2024By Keith Wright
NOTE: You can click on any image to view in a new window and you can download a PDF copy of this article on this link
Introduction
I looked at the analysis of the Betfair (BSP) market a few years ago in an attempt to better understand which price range it is more advantageous to operate in. With the advent of the Tote enhanced win and place markets, I’ve looked again at the BSP analysis along with the industry SP and also the Tote market.
All the data used in creating these analyses is easily available in Proform using the exporter function. Quite simply I choose the years I want to look at, tick boxes for the chosen variables (BSP, SP, Tote Enhanced Win in this case) and export the data. The data can be interrogated within Proform but for anyone who likes to do their own thing, the exporter is a brilliant tool.
V1.93 of the Proform software just released and includes the Tote API enhanced prices and if you are a Proform member you can gain access to a Tote Pro Player account allowing you to bet at these enhanced prices. You can read more about this on the following link.
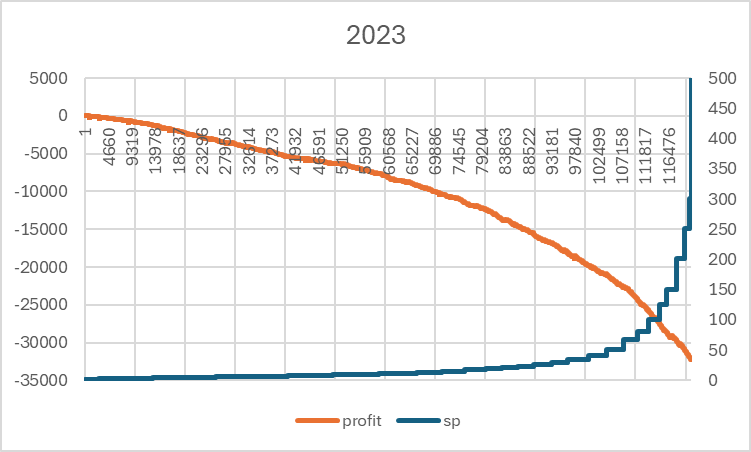
We’ll begin with the industry SP analysis and having looked at a number of years, rather unsurprisingly the data varies very little and the 2023 data is representative of most years. The charts show the respective starting prices (blue line) on the right-side axis, the points profit or loss (orange line) on the left axis and the number of runners on the horizontal axis.
An extremely consistent and efficient market which leaves us in no doubt as to why bookmaking, if done correctly, is very profitable.
This chart tells us that by backing the shortest priced horse in the race (the blue line starting on the left) and not backing joint favourites, we would lose approximately 7.6% (It looks like zero on the chart but that’s purely because of scale and the volume of data). Incidentally, the loss over the past ten years is 7.61%. As we move away from the single favourite, we can see the loss increases exponentially. This explains graphically why the bookies say a winning favourite is bad news for them, not necessarily because they lose money (although they occasionally will) but it’s more the case that they don’t make as much profit.
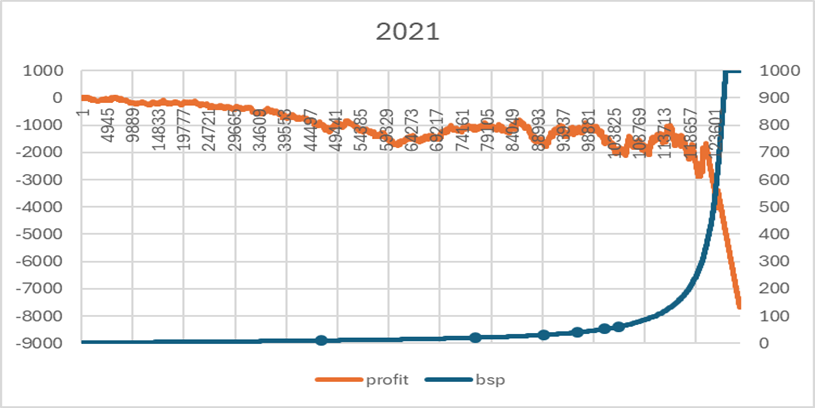
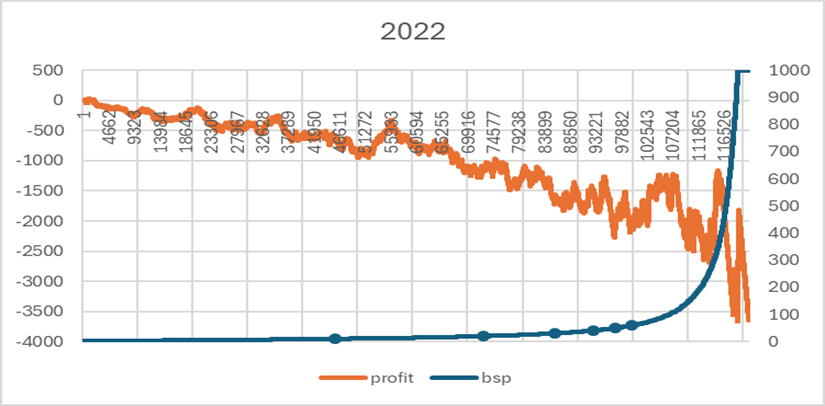
If we now look at the Betfair market we will see there is much greater variation in the efficiency (the loss incurred) at any given price. Here’s a sample of some analyses from the past few years. The blue markers on the blue line indicate BSP’s of 10, 20, 30, 40, 50 & 60. And here’s the year by year data for Betfair & Industry SP.
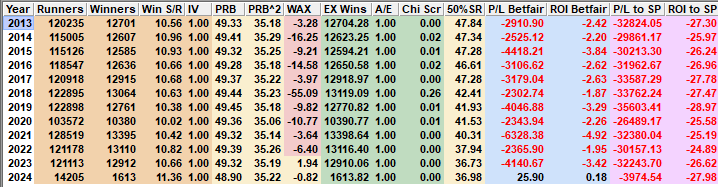
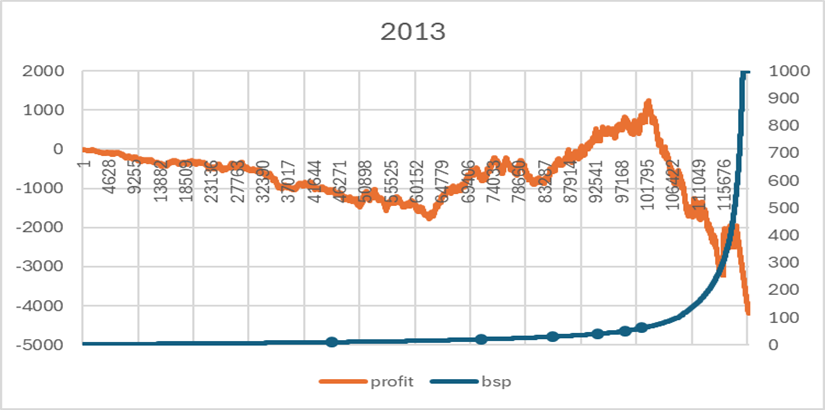
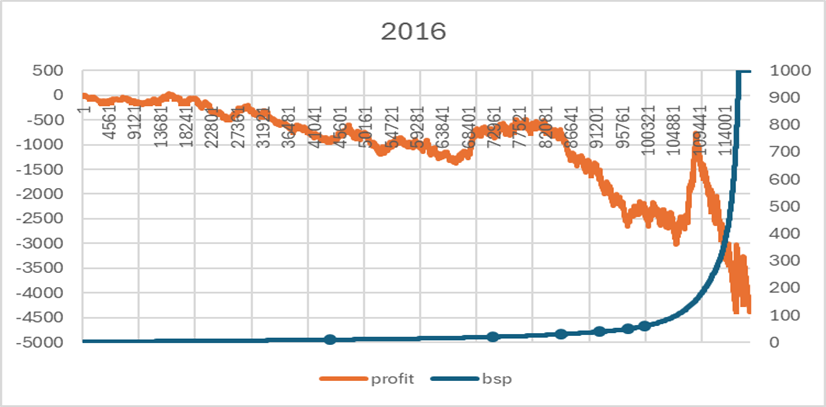
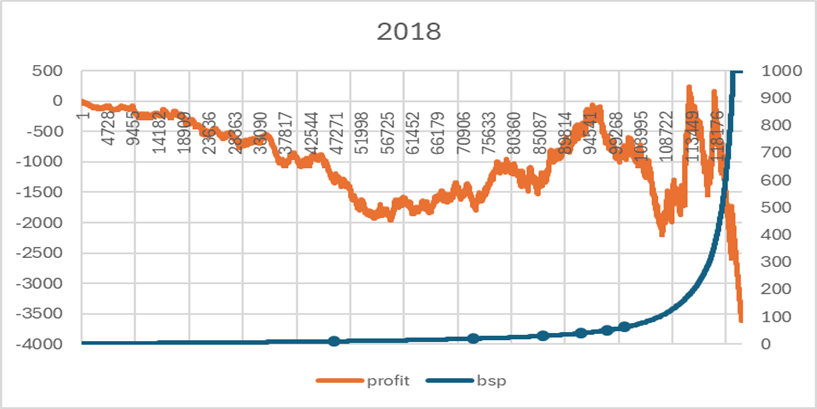
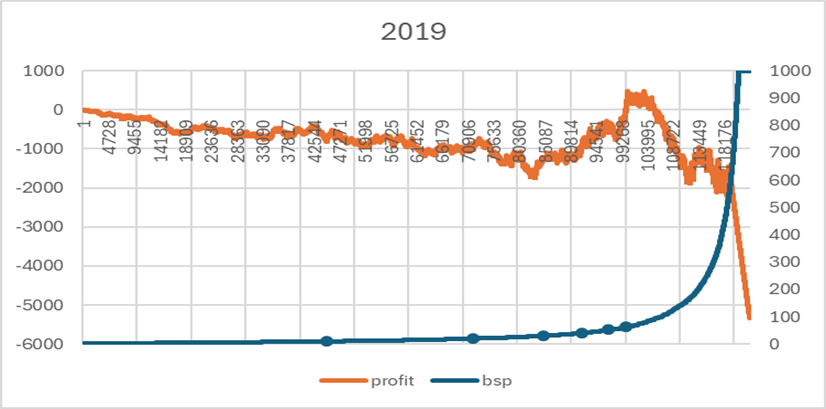
If we start with these earlier analyses, 2013 to 2019, we can see a similar trend to the Industry SP analysis in that the loss increases as the price increases. However, it should be clear to see that the line is much less smooth which suggests there are some prices where efficiency has more variance and this might give hope to the backer that as the orange line moves closer to zero when the price is increasing, we might find opportunities. Typically, in the above this price range would be BSP 30 to 70.
Covid year, 2020, was similar in pattern to the previous years but I’ve left it out as the sample is a little smaller.
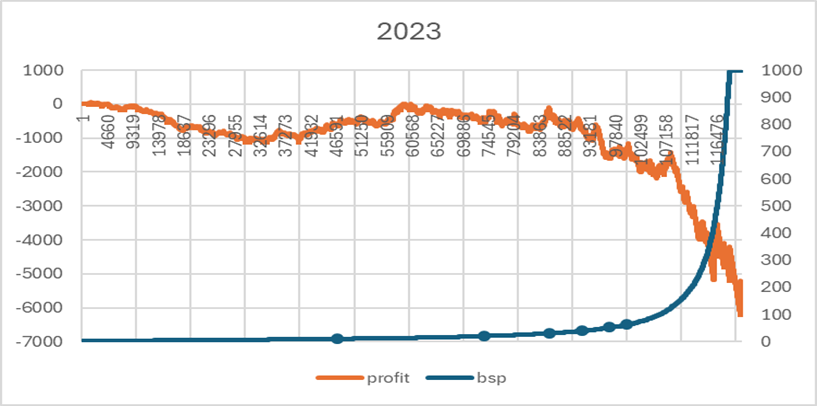
In 2021 & 2022 we can see the volatility is diminished somewhat in that there is no definable shift in the orange line moving closer to zero. 2021 looks pretty consistent but with the overall loss appearing to be less than in previous years (it isn’t, it’s just lower at bigger prices). 2022 is similarly consistent but the overall loss is actually less than pre-2021 levels. So, on the face of it, it appears the opportunities might have disappeared but as we know, past market performance should not be relied upon to predict future market performance. We see once again in 2023 a return to the overall loss being similar to the ten-year picture and the return of a relative inefficiency, albeit in a slightly lower price range of BSP 15 to 35.
And now the Tote. We only have data for the enhanced prices from November 2023 so any conclusions drawn should be considered ‘subject to change’.
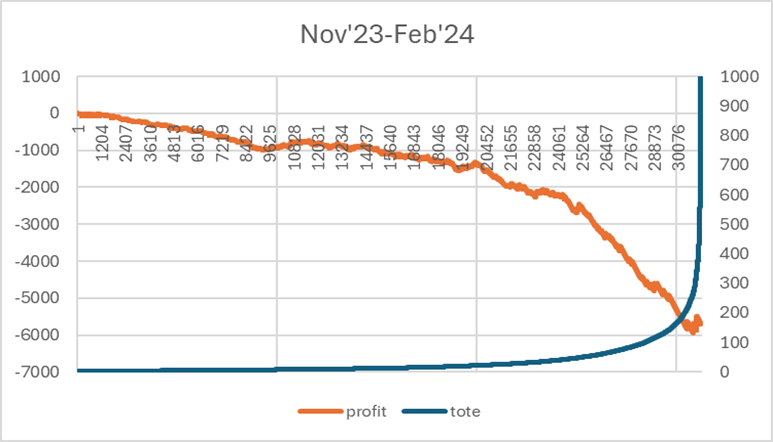
I think it’s fair to say the Tote chart represents the middle ground in that there is less volatility in the orange line making it more like the Industry SP chart but the losses are lower than in that same chart. I believe the intention is to move the Tote enhanced markets closer to BSP so this chart illustrates the size of that task. It must be said though the potential advantage of the Tote will be their exotics markets.
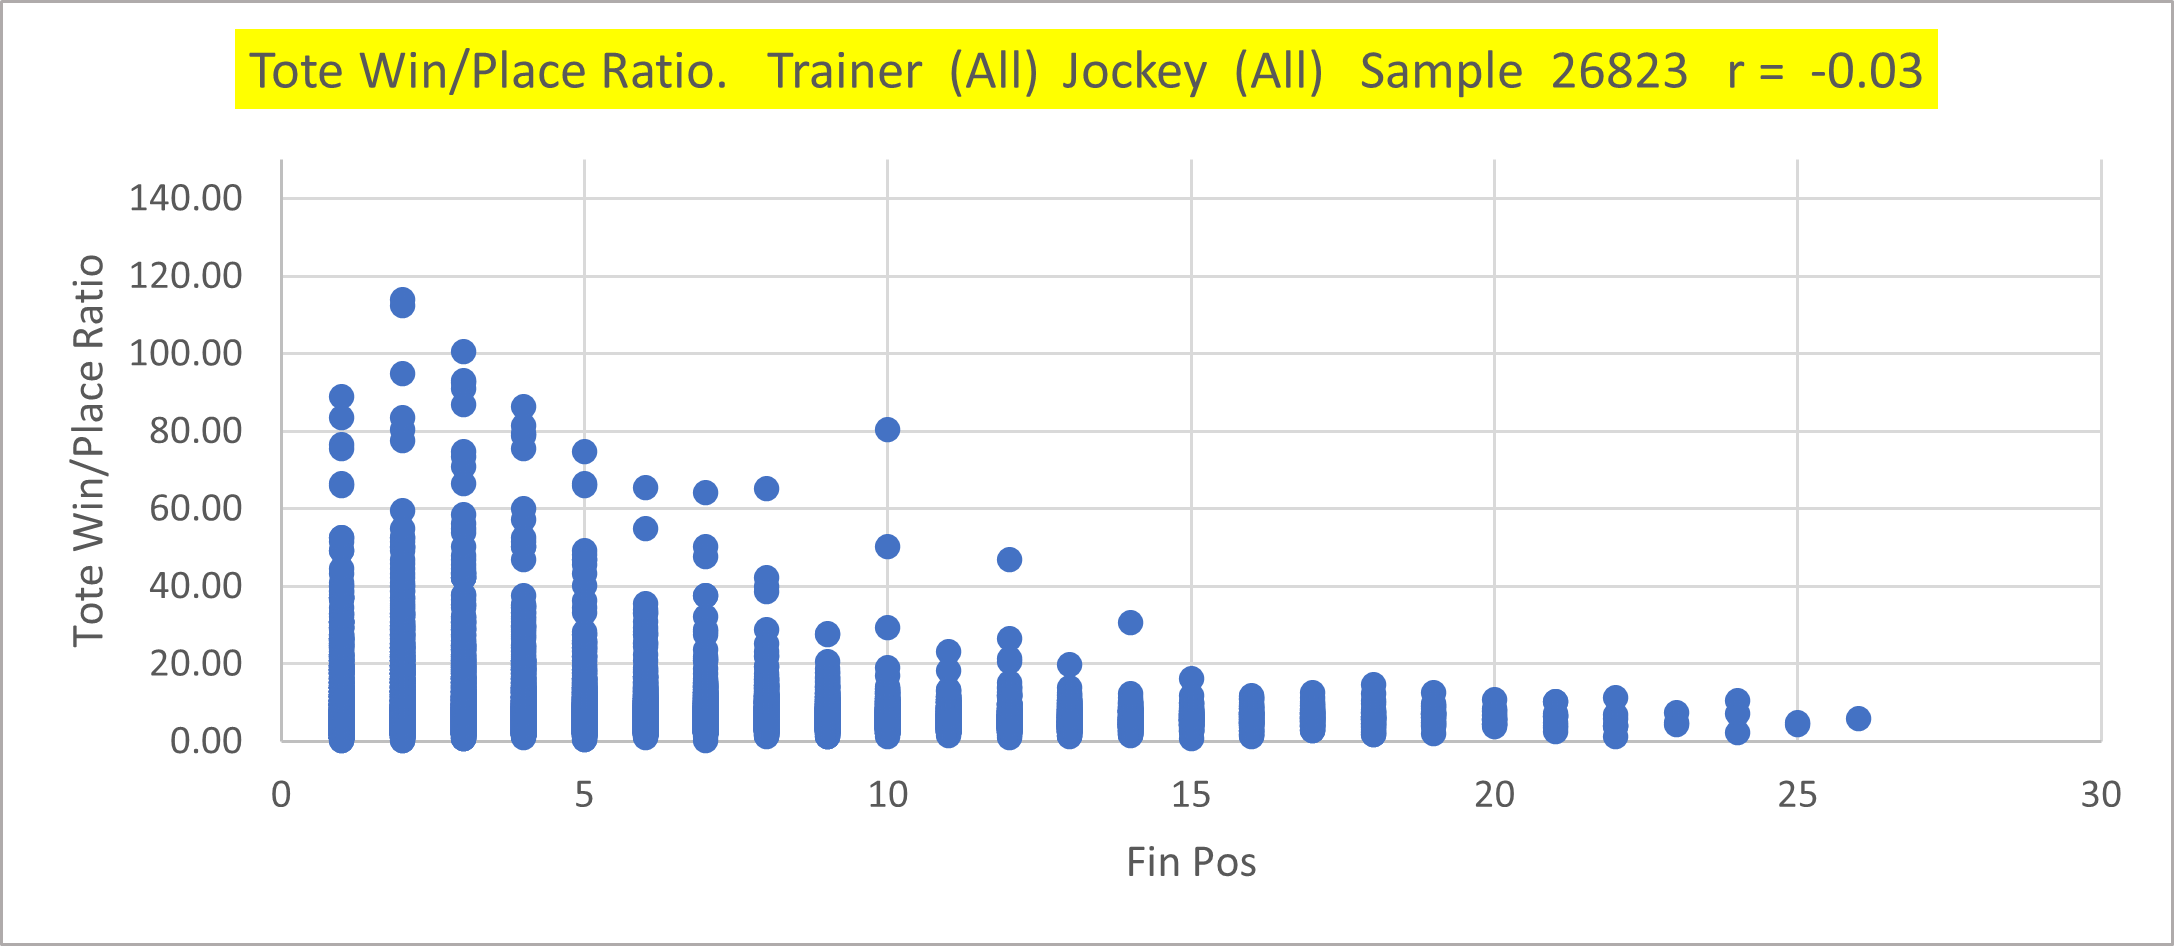
Given that I’ve included the Tote in the above analysis, there’s an additional analysis I’d like to share. Some years ago, I monitored (with some difficulty) the relationship between Tote win price and place price. I observed that when the ratio of win to place was higher than I might expect from an industry e/w ratio i.e. 5:1 the horses generally ran well. The ratio I was looking for was 7:1. So for example, if the Tote win price was £4.50 and the place price was £1.30 I would deduct 1 from each (the stake that’s included) and divide the win by the place. In this example I would get 3.50 / 0.30 = 11.7.
The logic behind my thinking may have been slightly flawed but the reasonable success I had with this method brought some enjoyment. Now that Proform has the Tote enhanced win and place data built in, I was able to export it and test my theory; here’s the resulting analysis.
And for comparison the analysis using Betfair win and place data.
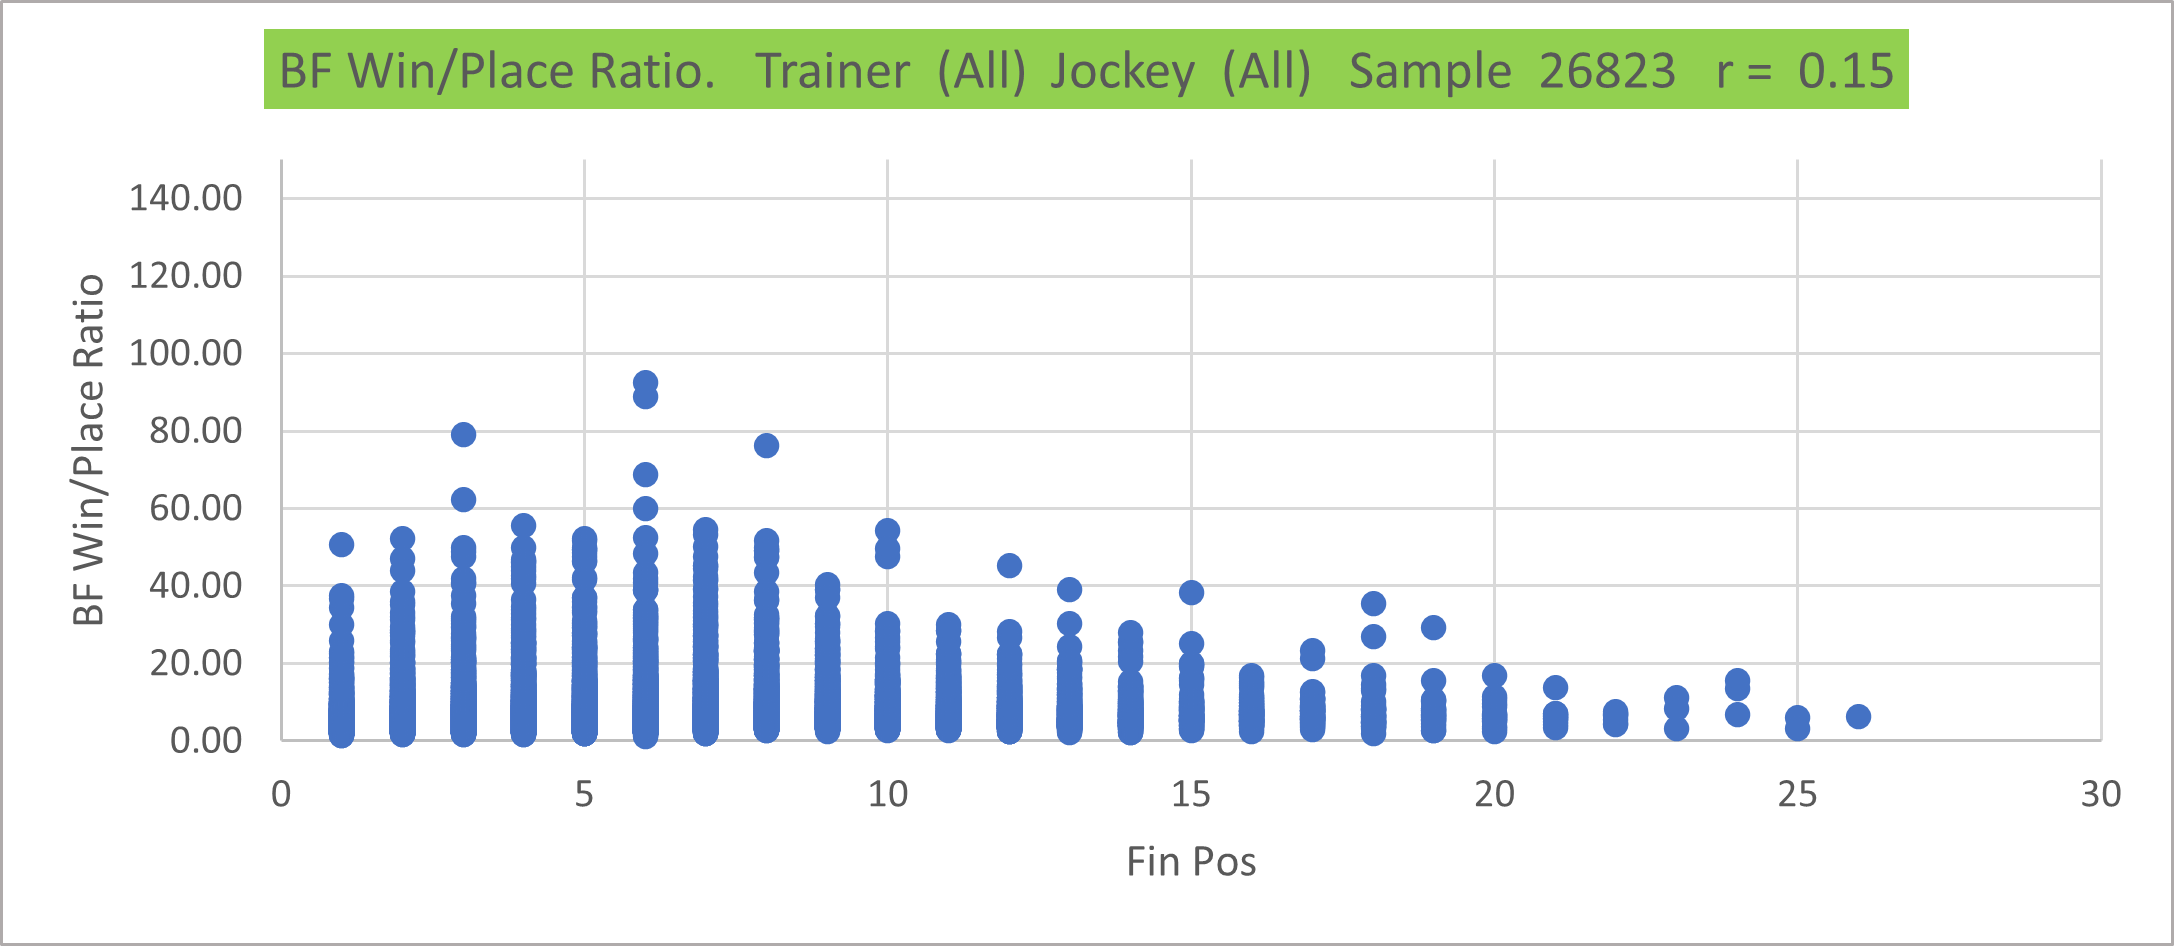
The Tote chart shows that as the ratio increases so does the chance of the horse winning. The same can be said of the Betfair ratios but less so. This is backed up by the ‘r’ number which is very close to zero in both cases but is negative in the Tote chart. The statistical measure ‘r’ is the correlation coefficient, in other words it tells us how strong the relationship is between two datasets or variables.
So, next time you look at the results, take a minute to review the Tote win & place dividends and do the quick maths.
(Win price minus 1) divided by (Place price minus 1) = Ratio
It’s not the silver bullet but it might enhance what you’re already doing.
by Keith Wright
Involved in racing as a serious hobby for more than thirty-five years, always believing there’s a holy grail; there isn’t. What there is, in my view, is a set of tools, strategies & methods which enable us to get nearer to sustained profitability and greater enjoyment.
My background is engineering and more recently delivering ‘software as a service’ to the public sector.
I’ve done quite a bit of work on dosage (using breeding to determine a horse’s likely distance preference) and I’ve had one or two notable successes. I’m now part of a small team researching new angles using various analyses with a focus on being agile enough to adapt to the rapidly changing form cycles of horses.
The single most important thing I’ve learned about backing horses is to have realistic expectations. Even bookmakers have losing days and we will have more than they do. So long as we expect it, accept it and manage it, then we’ll be okay.
