
Trainer forensics: which jumps yards beat the Betfair price in 2025/26?
Twenty trainers sent out 52 or more jumps winners in Britain and Ireland last season, and between them they trained more than a third of every jumps winner run. We put every one of their 11,197 runners through the same test as our jockey forensics: what did the Betfair price expect, and what did the yard deliver?
The short version
- The market prices the big yards almost exactly. The 20 sent out 1,885 winners against the 1,906 their Betfair prices expected: an A/E of 0.99. A/E is actual winners divided by the winners the prices said should win; 1.00 means the market had them exactly right.
- Twelve beat the price, led by Ben Pauling (1.11), Jamie Snowden (1.09) and Nicky Henderson (1.08). Willie Mullins sent out the most winners, 213, and still came in just under par at 0.96: the market already knows how good the horses are.
- Fresh or fit splits the yards. Harry Derham's runners back from 61 days or more off ran at 1.54; James Owen's at 0.42, against 1.05 when already running.
- One horse made three seasons. Joe Tizzard was £380 up at Betfair SP; £450 of that was Fight My Fire, the same 459/1 winner that made a jockey's season. Neil Mulholland and Gordon Elliott each owe their profit to one winner at more than 240/1.
The league table
Sorted by winners, with each yard's strike rate, A/E and the profit or loss from a £1 bet on every runner at Betfair Starting Price, after 2% commission.
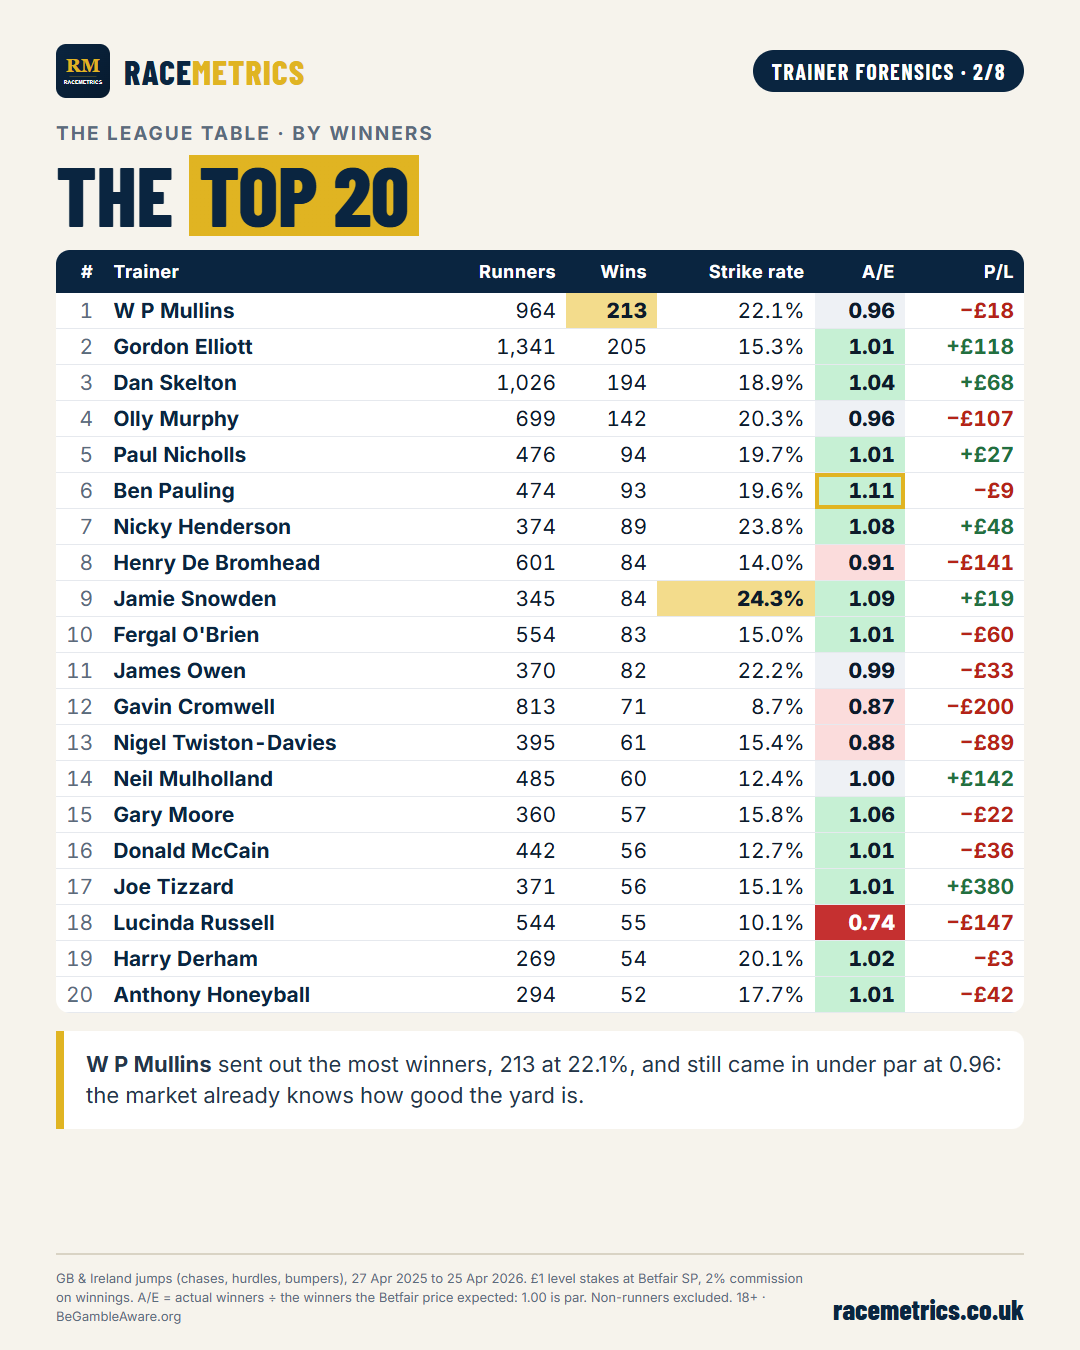
Willie Mullins, Gordon Elliott and Dan Skelton each sent out close to 200 winners or more, and all three sit within a few points of par: 0.96, 1.01 and 1.04. Jamie Snowden had the best strike rate, 24.3%, and still beat the price at 1.09.
Which yards beat the price
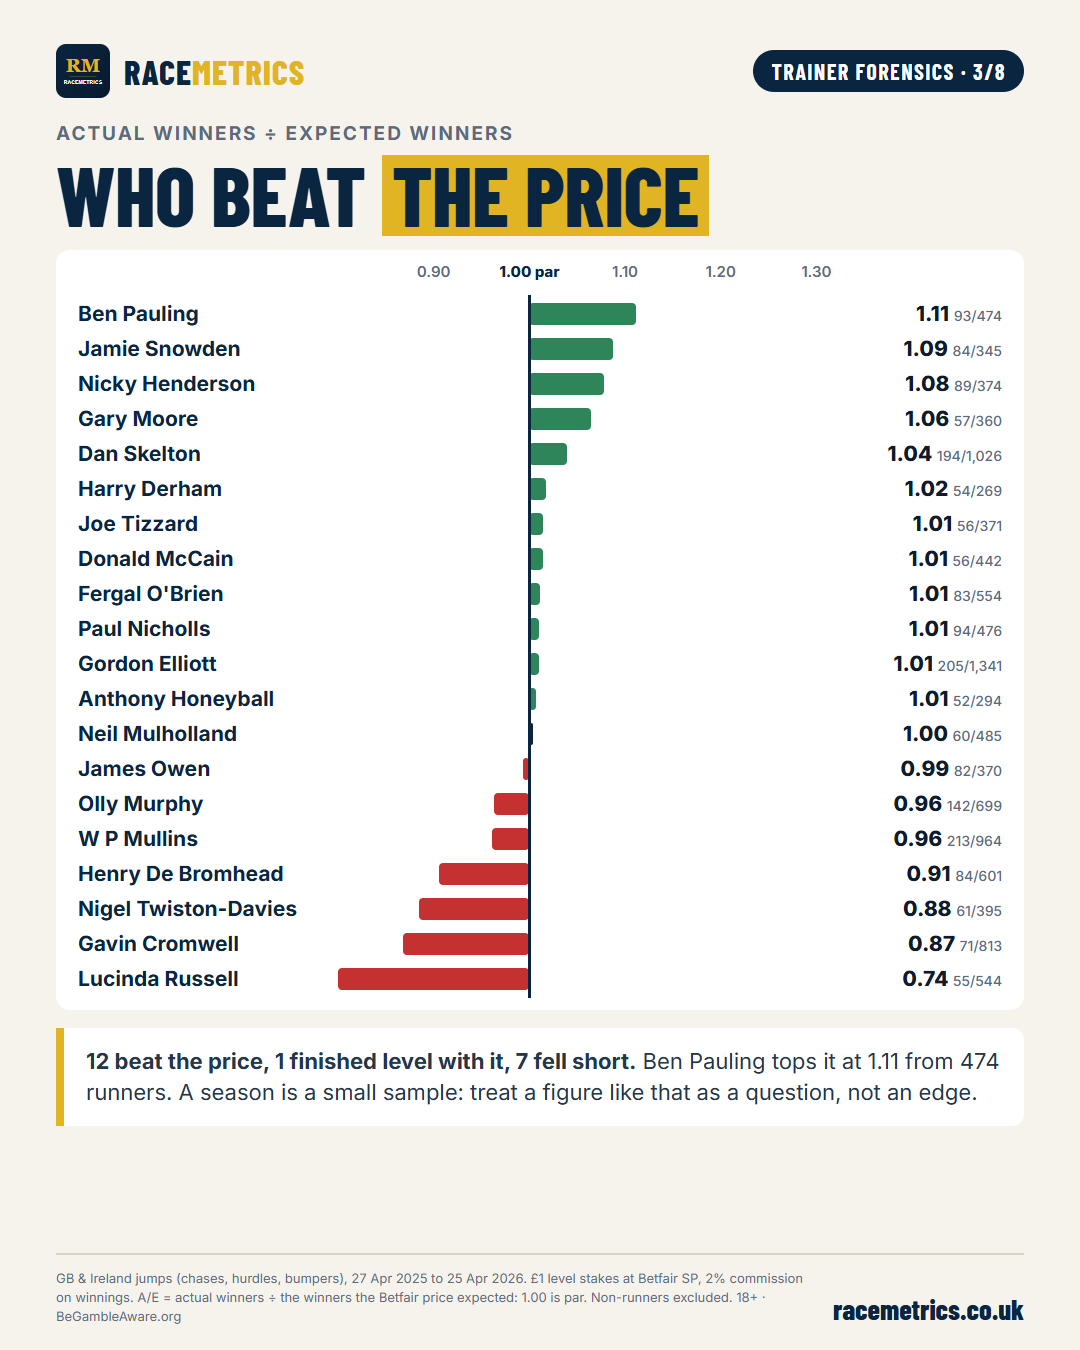
Twelve of the 20 finished above par, one level with it and seven below. The spread is much narrower than for the jockeys: only Lucinda Russell (0.74), Gavin Cromwell (0.87) and Nigel Twiston-Davies (0.88) sit well away from 1.00. A season is a small sample, so read a figure like Ben Pauling's 1.11 as a reason to look closer, not proof of an edge.
Same yard, different ground
The runners split by the official going on the day: Good to Soft or faster against Soft or Heavy.
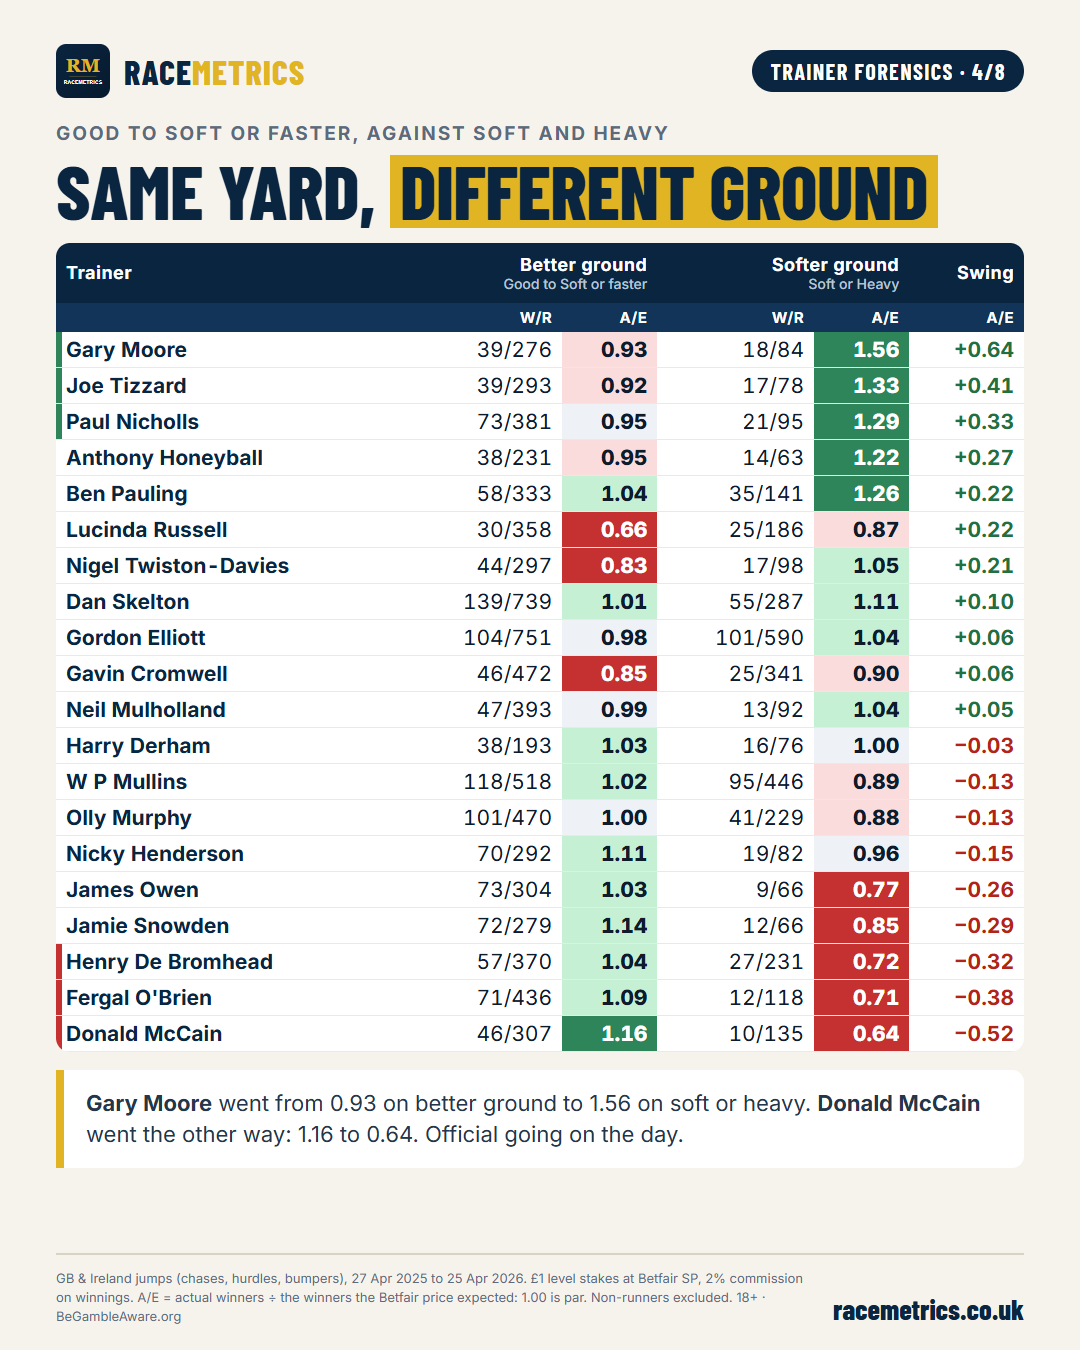
Gary Moore (0.93 to 1.56) and Paul Nicholls (0.95 to 1.29) found more when it turned soft. Donald McCain (1.16 to 0.64) and Fergal O'Brien (1.09 to 0.71) went the other way. Most of the soft-ground samples are under 150 runners, so treat these as leads.
Fresh or fit?
Here each yard's runners are split by days since their last run: back within 60 days, against 61 days or more off. Horses making their debut are left out.
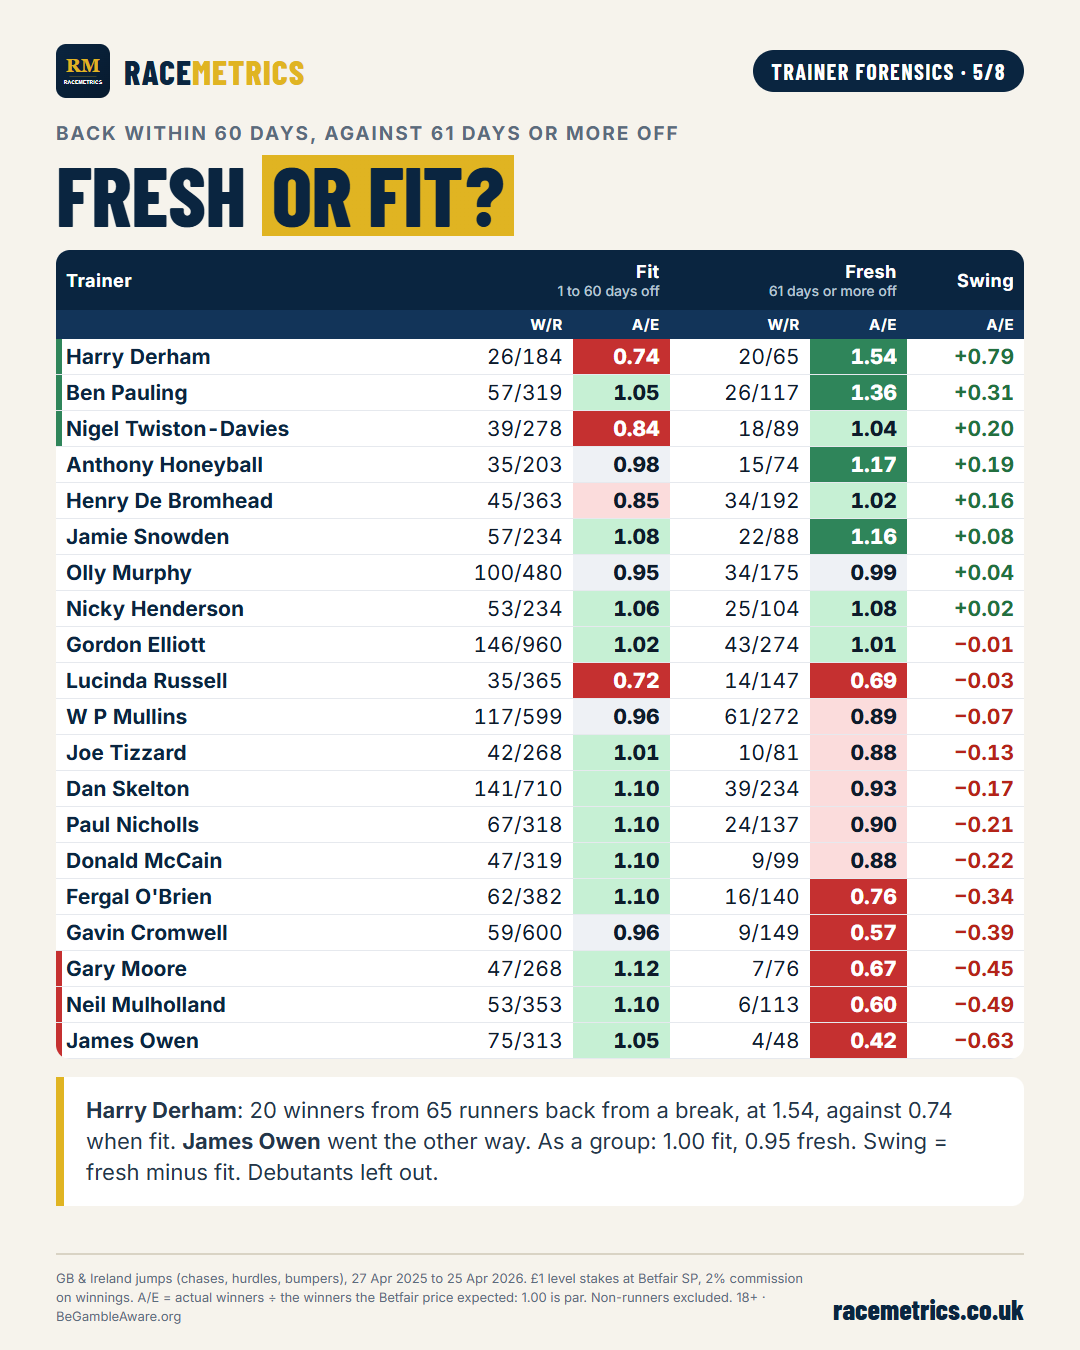
Harry Derham's horses were at their best fresh: 20 winners from 65 runners back from a break, at 1.54, against 0.74 when already running. Ben Pauling showed the same shape. James Owen, Neil Mulholland and Gary Moore were the opposite, well above par with a fit horse and well below it fresh. As a group the 20 ran at 1.00 fit and 0.95 fresh. The Grid at the foot of this article splits it finer: across the 25 busiest yards, runners back after 181 days or more came in at 0.88.
Where the price was right
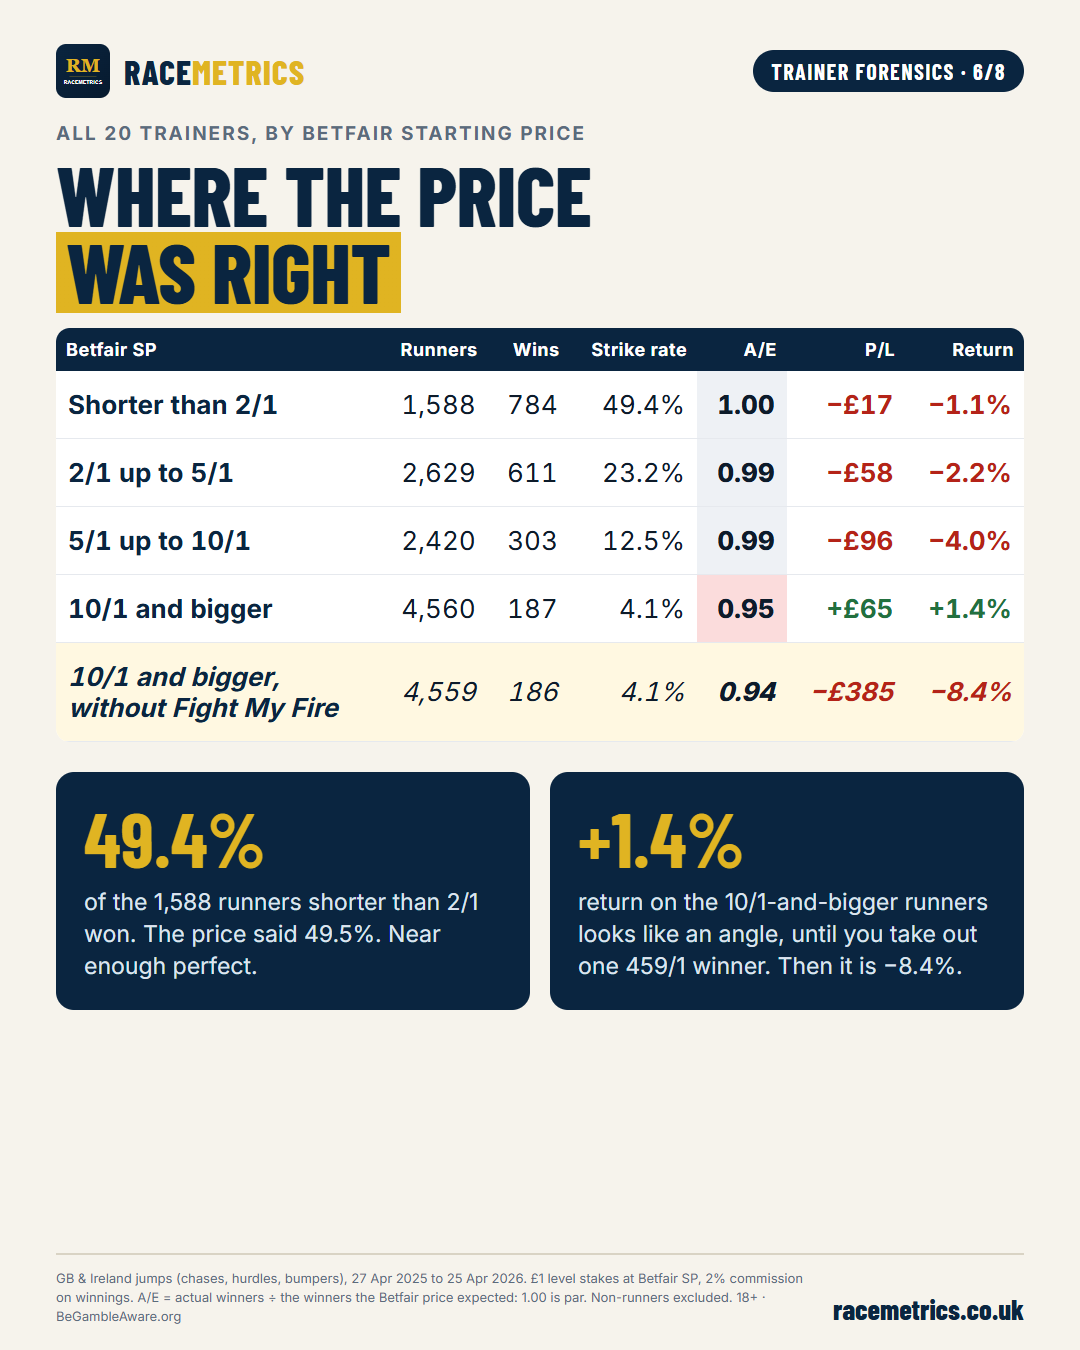
Group every runner by price and the market comes out right almost everywhere. Of the 1,588 runners that went off shorter than 2/1, 49.4% won; the prices said 49.5%. The 10/1-and-bigger runners showed a 1.4% return, which turns into minus 8.4% without one result.
One horse can make a season
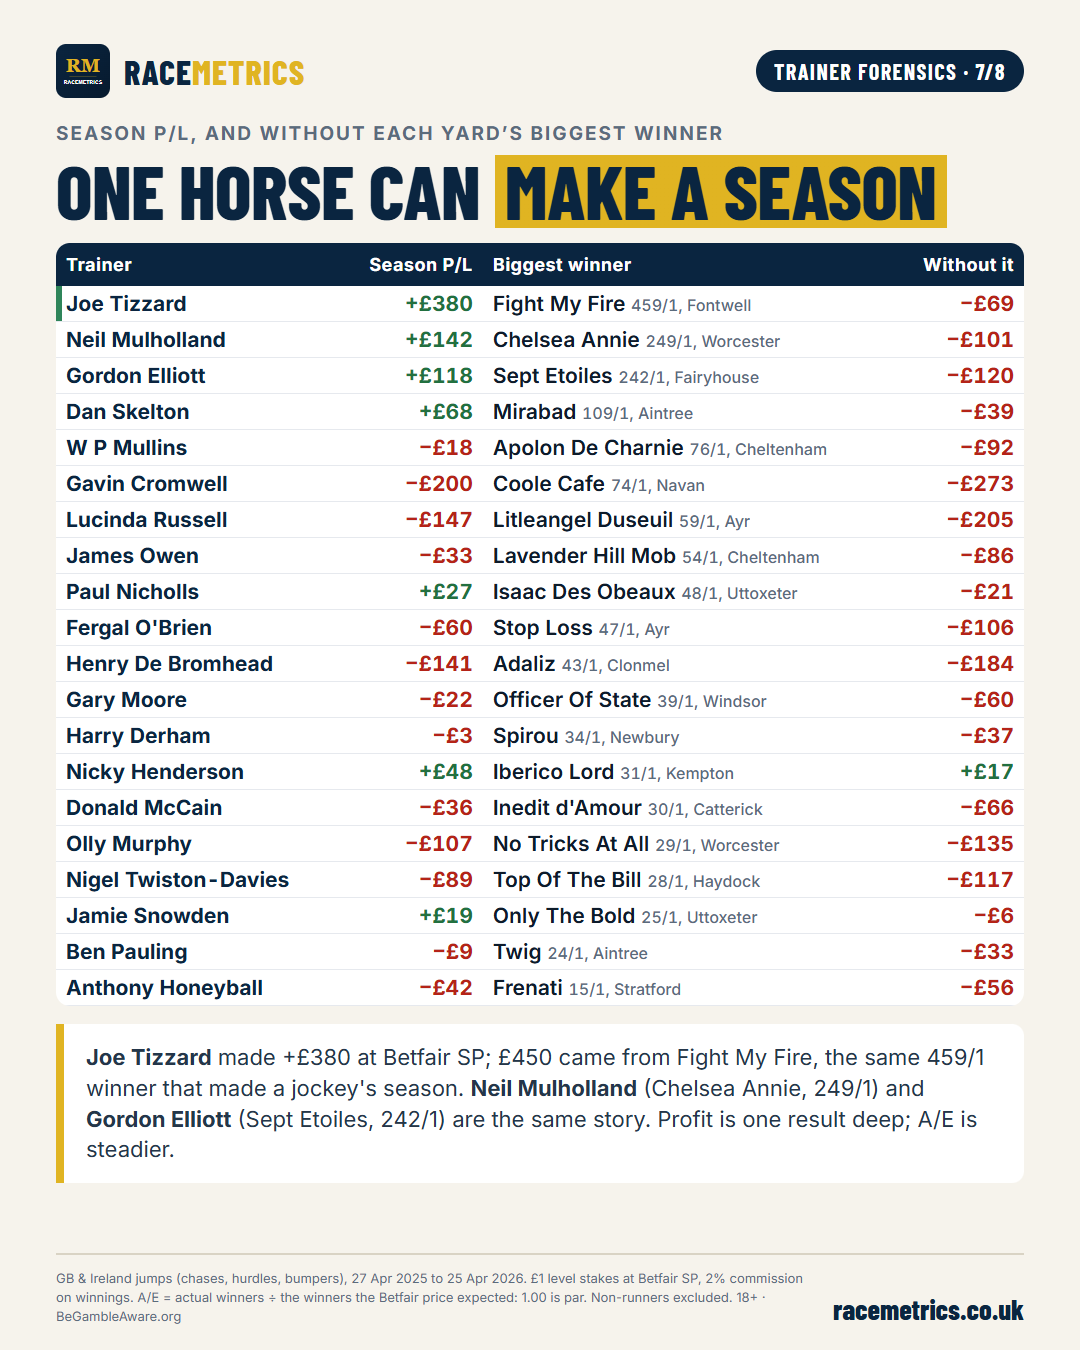
That result was Fight My Fire again, the 459/1 winner of a Fontwell maiden hurdle on 26 October 2025. It turned Joe Tizzard's season from £69 down into £380 up, just as it did for Brendan Powell in the saddle. Neil Mulholland (Chelsea Annie, 249/1 at Worcester) and Gordon Elliott (Sept Etoiles, 242/1 at Fairyhouse) are the same story: take out that one winner and all three finish in the red. Only Nicky Henderson's yard stays in profit without its biggest winner. When you compare yards, read A/E first and profit last.
Build these tables yourself
Every table here comes from the same data our members use in the System Builder. Set the dates, add Race Type (Chase, Hurdle, NHF), then on the Grid tab put Trainer down the side and Days Off across the top, and pick A/E at Betfair SP. Swap Days Off for Going and you have the ground table. It works for any season back to 2018, any course and any class.
A yard above par last season is a question to ask this season, not a bet to strike. Which ones will you be watching?
How we measured it
Every runner in a chase, hurdle or National Hunt flat race in Britain and Ireland between 27 April 2025 and 25 April 2026, non-runners left out. The 20 trainers are everyone with 52 or more winners. A/E compares each yard's winners with the sum of their horses' chances at Betfair Starting Price. Profit and loss is a £1 level stake on every runner at Betfair SP, with 2% commission taken from winnings. Ground uses the official going on the day; fresh means 61 days or more since the horse last ran.
18+. Please gamble responsibly: BeGambleAware.org