

Who can go the distance in the Epsom Derby?
June 6th, 2015Considered to be the most prestigious of the country's five Classics, a horse requires a unique balance between speed and stamina to win the richest prize of the Flat season on the racecard at Epsom.
In this week blog post, we use the powers horse racing software and race guides to determine which of this year’s Derby contenders are suited to the race distance from the perspective of breeding.
How We Crunched the Numbers
When information is limited regarding a horses form or ability, we can leverage numerous breeding studies that highlight the fact that a horse’s preference for a particular distance is derived from genetic traits past to it through various ancestries and blood lines.
From the multitude of data for each horse race, within Proform information is sub divided into different categories.
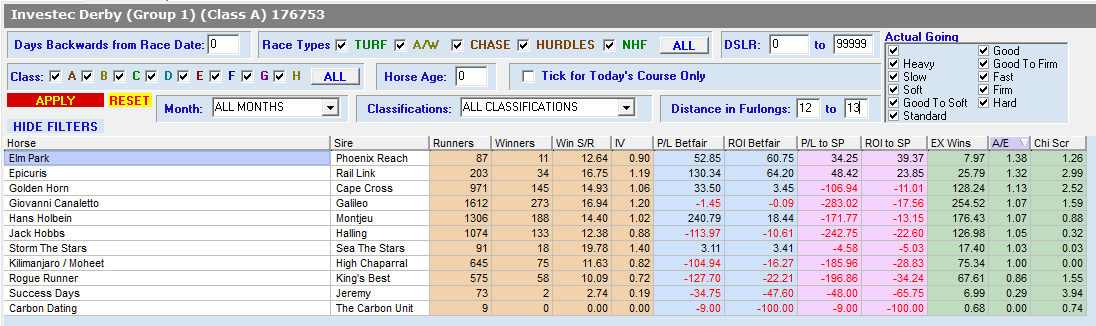
click on image to open in another window
Under the “Sire” Tab shown in the image above, we can use filter tools to narrow the race parameters of interest in this case the record of a sires progeny and display results in columns.
The data above is ordered by Actual vs. Expected (A/E Index)
The A/E index is an improved metric compared to say percentages (and its inherent flaws).
The A/E index is calculated as follows
A/E Index = Actual Win [divided by] Expected Win
The output of the A/E calculation results in a number:
· an A/E Index of 1 is considered to be as expected suggesting the result is what you expect given a normal sequence of events
· an A/E Index of greater than 1 is better than expected i.e. better than normal
· an A/E Index of less than 1 is worse than expected, i.e. below what you would expect given a normal sequence of events
If we assume that a value of 1 is equivalent to a value of 100%, then any residual above or below 1 in the A/E index can be expressed as percentage.

Derby Contenders by Breeding (Race Distance)
One of the unique features of the Proform race guide is that it uses a combination of shapes and colours to organise and represent data.
The key benefit is that you don’t waste time trying to detect patterns in a bunch of numbers, we do the hard graft for you by querying and tabulating results from our software as show in table below.
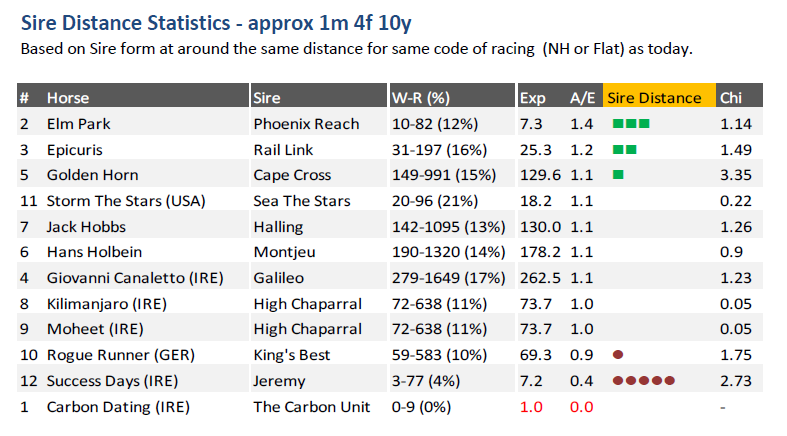
The Race Guide Sire Distance table provides a general summary of key stats for each horse and is ordered by descending order of A/E.
Using the information in the table applied tothe Derby distance (around 1mile 4 furlongs), we can easily determine that horses sired by Phoenix Reach (Elm Bpark) perform 40% better than expected, those sired by Cape Cross (Golden Horn) perform 10% above expected.
Around the Derby distance of 1m4f, horses sired by Jeremy perform approx. 60% less than expected.
From the information above we can easily determine using our horseracing statistics which horses based on breeding have the “potential” (there are no certainties in racing) to go the distance in the Derby and factor this knowledge into our pre-race thinking.
Do you want to see more?
Every day on our web site we provide a FREE stats and Race Guide.
As well as providing detailed horse racing statistics with profit pointers, our race cards contain horse ratings for each contestant, unique pace information for every runner plus other time saving features to make pre-race analysis easy.
To download today’s Proform Race Guide for the Derby, click on the link here
